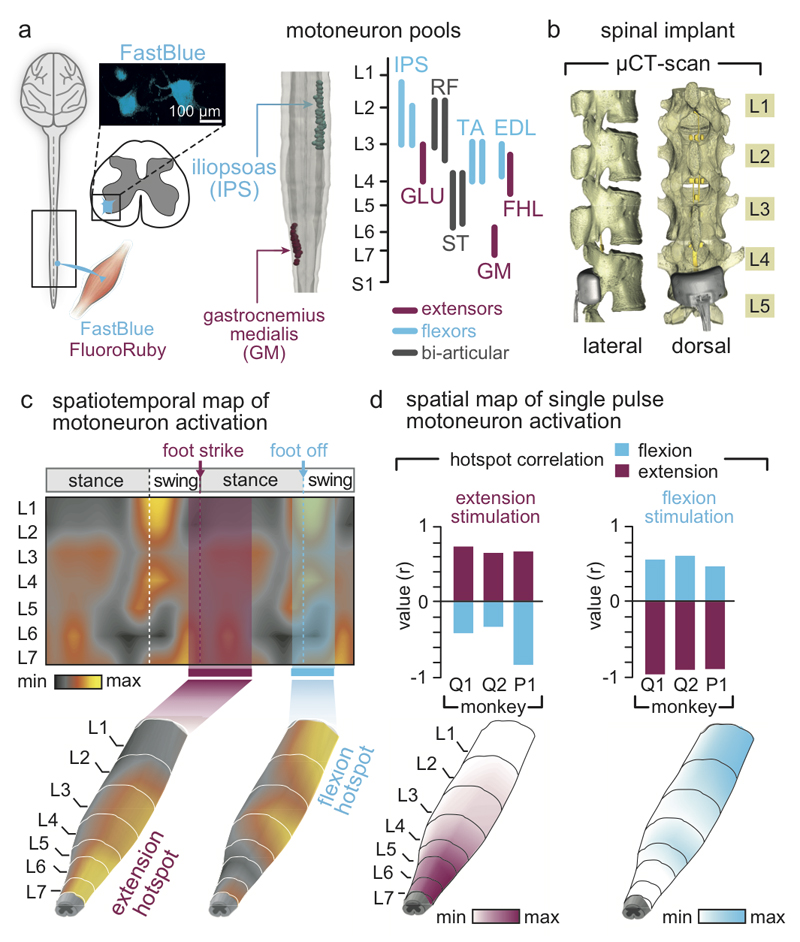
Figure 2. Development and validation of selective spinal cord stimulation protocols.
(a) Diagram illustrating injections of retrograde anatomical tracers into leg muscles to label motoneurons. The inset shows a confocal photograph of labelled motoneurons. The 3D reconstruction shows each labelled motoneuron innervating iliopsoas (IPS) and gastrocnemius medialis (GM) muscles. The same procedure was applied to the gluteus medius (GLU), rectus femoris (RF), semitendinosus (ST), extensor digitorum longus (EDL), and flexor hallucis longus (FHL) muscles. The diagram reports the averaged (n = 1 to 3 monkeys per muscle) distribution of leg motoneurons within the spinal cord. (b) Representative micro–computed tomography (µCT) scans of the spinal implant (monkey Q1). (c) Electromyography of the recorded leg muscles (monkey Q1) was projected onto the motoneuron locations in the spinal cord to compute the mean (n = 73 gait cycles) spatiotemporal map of motoneuron activation during locomotion. Maps recorded around foot off (-10% to +20% of gait cycle) and foot strike (-10% to +30%) were extracted to highlight extension and flexion hotspots (data from other monkeys in Extended Data Fig. 3). (d) Median (n = 6 pulses) spatial map of motoneuron activation resulting from single pulses of stimulation delivered through the electrodes targeting the extension and flexion hotspots. For each monkey, the bar plots report the correlation between these spatial maps and the maps corresponding to the extension and flexion hotspots.

