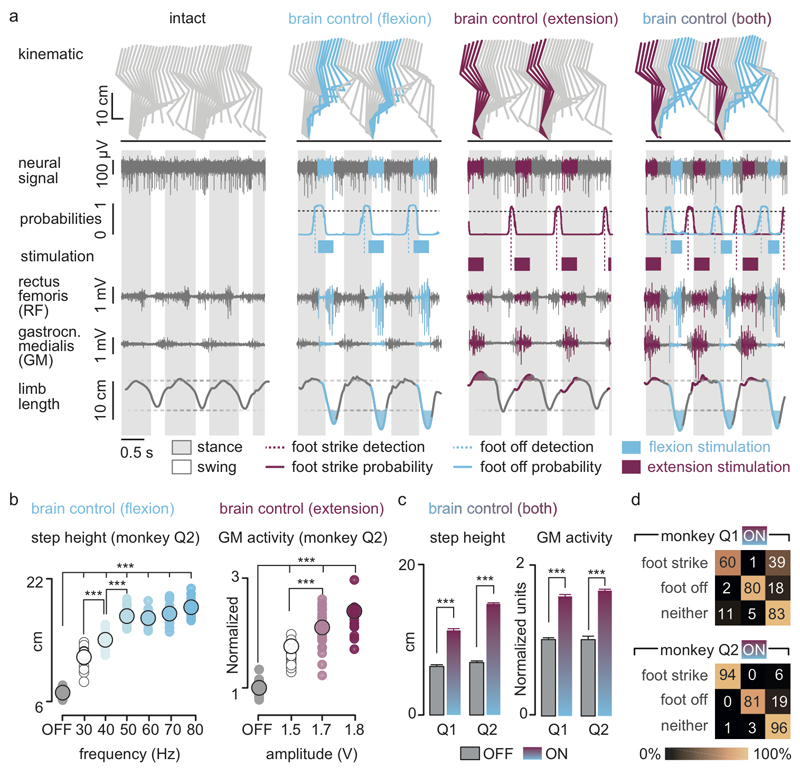
Figure 3. Brain-controlled stimulation modulates the extension and flexion of the leg during locomotion in intact monkeys.
(a) Two successive gait cycles recorded during locomotion without stimulation and during brain-controlled stimulation of the flexion hotspot, extension hotspot, or both (monkey Q2). From top to bottom: stick diagram decompositions of right leg movements; example of single channel neural recording; probability of foot off and foot strike motor states; detected motor states (cyan and magenta broken lines), periods of stimulation through the electrodes targeting the flexion and extension hotspots; electromyographic signals; limb length calculated as distance from the hip to the fifth metatarsal joint. The grey and white backgrounds correspond to stance and swing, respectively. (b) Relationship between frequency of brain-controlled flexion stimulation and step height, and between the stimulation amplitude and the activity of the GM muscle during brain-controlled extension stimulation. Values for individual gait cycles (smaller dots) and mean values (larger dots) are shown. (c) Bar plots reporting the mean step height and mean GM activity without stimulation and during brain-controlled stimulation for monkeys Q1 (n = 125 steps) and Q2 (n = 119 steps). (d) Decoder confusion matrices calculated during brain-controlled stimulation for monkeys Q1 (n = 125 steps) and Q2 (n = 119 steps).

