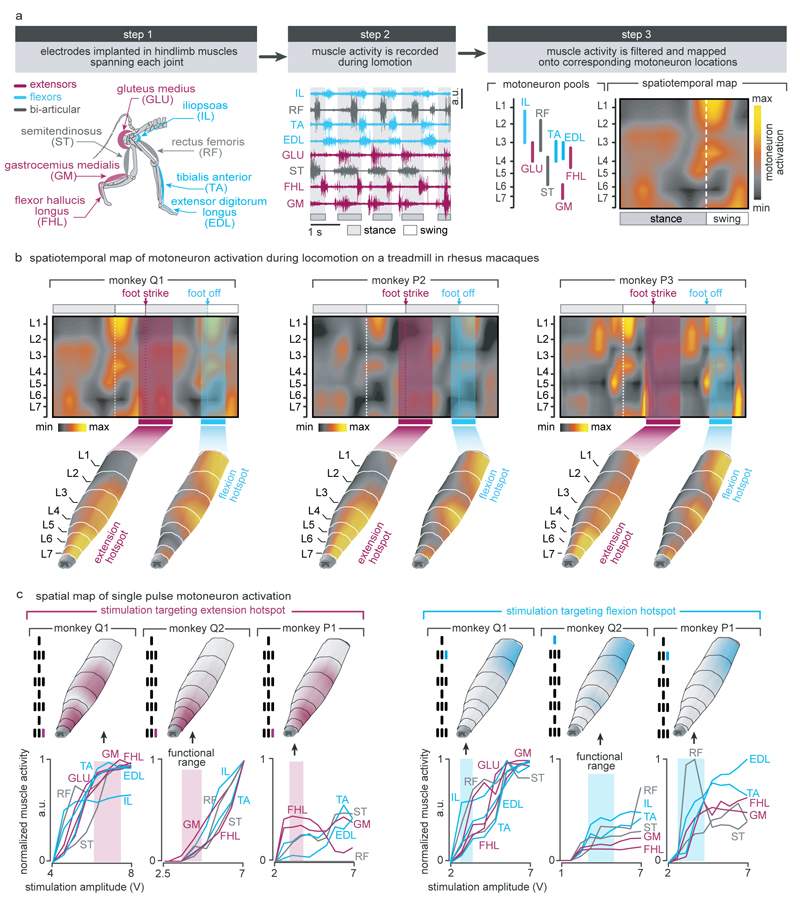
Extended Data Figure 3. Anatomical, computational, and functional experiments allowed the identification of stimulation protocols to access flexion and extension hotspots.
(a) Computational procedure to estimate spatiotemporal maps of motoneuron activation during locomotion. Step 1: Four pairs of antagonist muscles spanning each joint of the leg are implanted with bipolar electrodes to record electromyographic signals during locomotion. Step 2: Muscle activity recorded during locomotion on a treadmill is band pass filtered using a Butterworth 3rd order filter (30-800 Hz, monkey P3), Step 3: The signals are rectified, filtered with a low pass at 10 Hz, normalized to the maximum activity recorded across all the gait cycles, and then projected onto the location of the corresponding motoneuron columns in the spinal cord for each of the recorded muscles. The estimated motoneuron activation is represented as a color-coded spatiotemporal map of motoneuron activation. (b) Spatiotemporal maps of motoneuron activation recorded in three intact monkeys (Q1, P2 and P3). The maps were obtained by averaging electromyographic signals recorded during continuous locomotion on a treadmill (n = 73, 25 and 24 steps for monkey Q1, P2 and P3, respectively). The maps underlying the activation of extension and flexion hotspots were extracted by averaging the estimated motoneuron activation around the foot strike and foot off events, respectively. For this, a window was defined from -10% to +30% of the gait cycle duration for the foot strike event, and from -10% to +20% of the gait cycle duration for the foot off event. The maps were reproducible across monkeys: correlation between monkey Q1, P2 and P3 for the flexion hotspot was 0.94, 0.90 and 0.90 for Q1-P2, Q1-P3 and P2-P3, respectively. Correlation between monkey Q1, P2 and P3 for the extension hotspot was 0.88, 0.90 and 0.60 for Q1-P2, Q1-P3 and P2-P3, respectively. The resulting maps were projected onto the reconstructed spinal segments (Extended Data Fig. 1). (c) Recruitment curves showing the relationships between motor evoked potentials elicited by single pulses of epidural electrical stimulation in each of the recorded hindlimb muscles and the stimulation amplitude for three intact monkeys (Q1, Q2 and P1). Stimulation was delivered through the electrodes targeting the extension and flexion hotspots. The compound responses elicited in leg muscles were rectified and integrated to calculate the amplitude of the responses, and then projected on the reconstructed spinal segments. The spatial maps of motoneuron activation corresponding to the optimal range of stimulation amplitudes to access the hotspots stimulation are displayed for each monkey, including the location of the electrodes with respect to spinal segments. To compute the optimal range of stimulation amplitudes to access each hotspot, we extracted the stimulation amplitudes for which the spatial map of motoneuron activation displayed the highest values of correlation with the spatial maps of the targeted hotspots. The cyan and magenta shadings highlight the functional range of stimulation amplitude for each hotspot and monkey.

