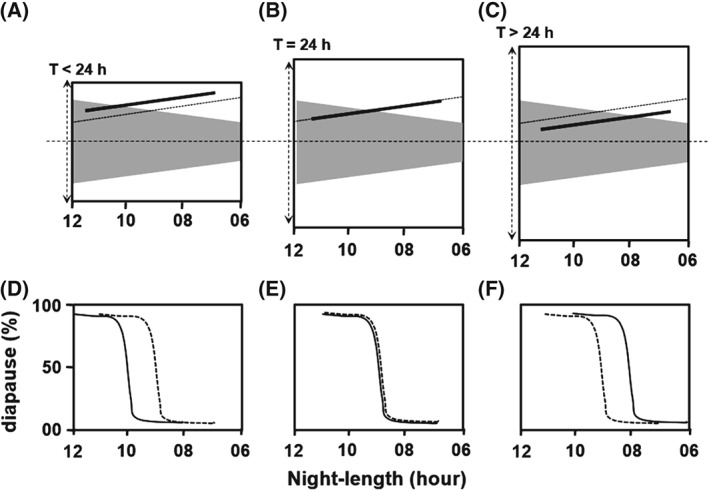
Figure 2.

Expected change in the photo‐inducible phase (ϕi) with photoperiod and Zeitgeber period (T). (A)–(C) Qualitative trends in the phase of ϕi as a function of night length at three Zeitgeber periods T < 24 h, T = 24 h and T > 24 h. (D)–(F) Corresponding change in the critical night lengths (CNL). For each Zeitgeber periodicity, the night is depicted as a grey area, with night length becoming shorter from left to right (starting with 12 h and ending with 6 h). The phase of ϕi and the photoperiodic response curves of the sustained oscillator based clock are depicted by a thick black line, whereas those of the damped oscillator based clock are indicated by a dashed line. For example, at T = 24 h (B), the transition of ϕi (thick black line) from dark to light occurs at a night length of approximately 9 h and thus has a CNL of approximately 9 h (E). On the other hand, the delayed occurrence of ϕi at T < 24h (thick line is pushed up) would make the CNL longer (e.g. 10 h) (A, D), whereas the earlier occurrence of ϕi (thick line is pushed down) would result in a shorter CNL at T > 24h (e.g. 8 h) (C, F). The ϕi of the damped oscillator based clock (dashed line) will not show such a dependency on T, thus leading to a constant CNL of 9 h at all the Ts. In conclusion, the photoperiodic response curves under T‐cycles can indicate whether the photoperiodic clock behaves as sustained circadian oscillator or a damped circadian oscillator.
