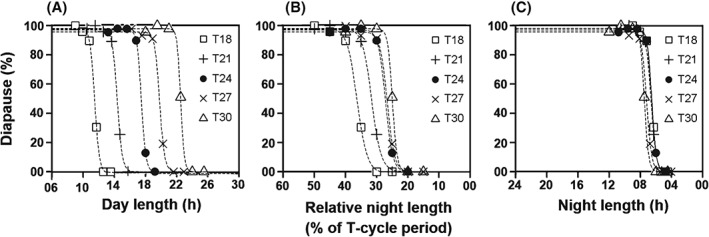
Figure 4.

Diapause incidence of Drosophila ezoana in response to different photoperiods under T18, T21, T24, T27 and T30 (Experiment 1). The photoperiod was varied from 50% to 85% of T‐cycle period (Table 1) and diapause incidence was estimated for each photoperiod in each of the T‐cycles. (A) Percentage of diapausing flies plotted as function of absolute day length. (B) Percentage of diapausing flies plotted as function of relative night length (as percentage of T‐cycle period). (C) Percentage of diapausing flies plotted as function of absolute night length. In each plot, data points for the different T‐cycles are represented by different symbols. Dashed lines depict the nonlinear regression model fitted to the data.
