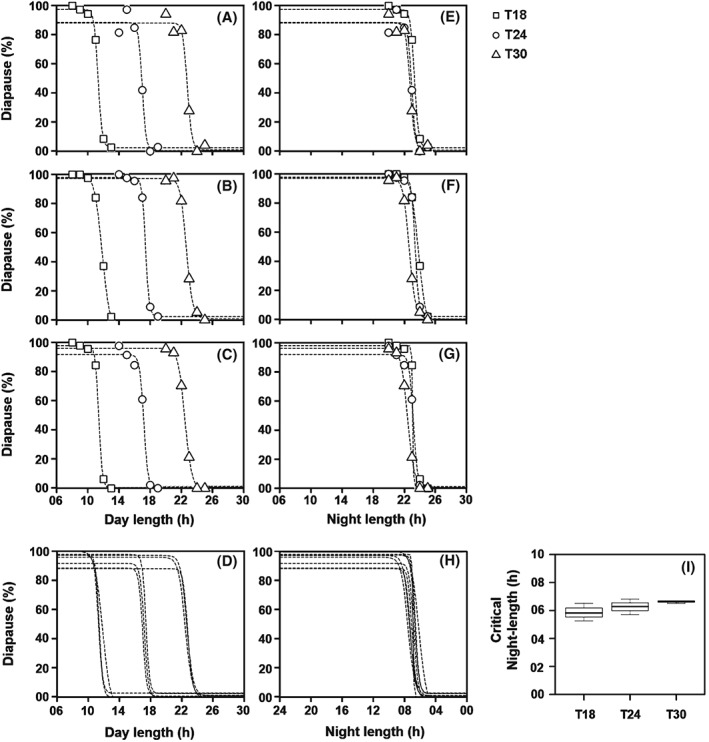
Figure 5.

Diapause incidence in Drosophila ezoana in response to different day and night lengths under T18, T24 and T30 (Experiment 2). Night length was varied from 5 to 10 h in each of the T‐cycles (Table 2). Percentage of diapausing flies is plotted as function of absolute day length (A–C) and of absolute night length (E–G) in three separate experiments. Labelling as in Fig. 4. (D and H) Regression lines from all the three experiments plotted together demonstrate the differences in the transition from diapause to reproduction across T‐cycles with respect to different day lengths but an almost identical critical night length (CNL) at all Zeitgeber periods (T). (I) CNL as a function of T. The CNL was calculated as 50% in diapause from the regression lines shown in (H) (R language package ‘dose–response curve’; Ritz & Streibig, 2005; R Development Core Team, 2008).
