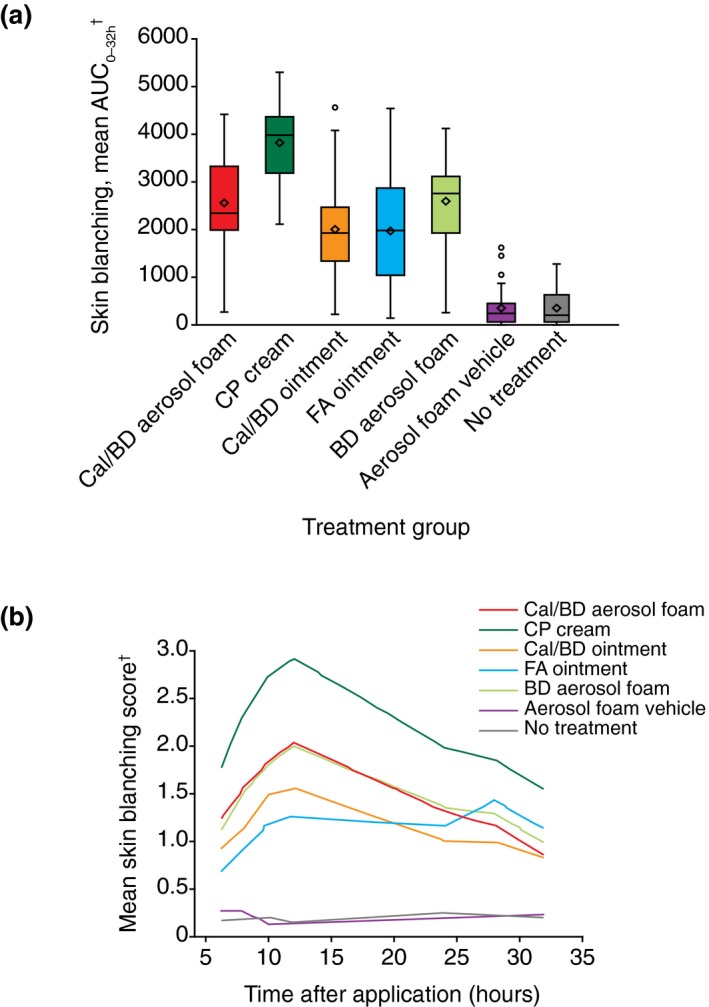
Figure 1.

Visual assessment of skin blanching. (a) Box plots of the visual assessment of skin blanching area under the curve (AUC0–32). The horizontal line represents the median and the diamond represents the mean, with the box representing the IQR, the whiskers representing the range within 1.5 × IQR and the circle showing the outliers (observations falling outside of 1.5 × IQR). (b) Mean visual assessment of skin blanching score obtained at each time point from two independent, trained observers. †Higher score indicates greater degree of skin blanching. BD, betamethasone 0.5 mg/g (as dipropionate); Cal, calcipotriol 50 μg/g; CP, clobetasol propionate 0.5 mg/g cream; FA, fluocinolone acetonide 0.25 mg/g ointment; IQR, interquartile range.
