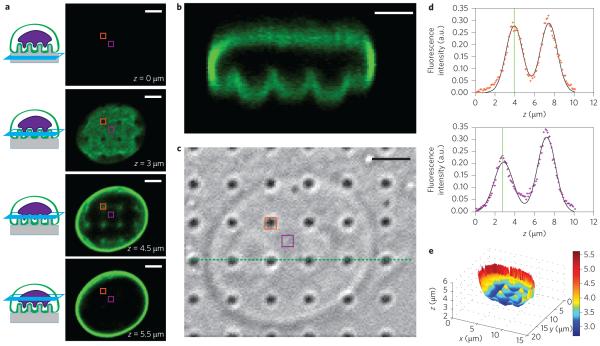
Figure 2. Quantitative analysis of nanopillar-induced nuclear deformation.
a, Immunostaining of lamin A reveals nuclear deformation in confocal microscopy. Four optical z slices are shown, beginning from the basal surface of the cell. b, Reconstructed side view of the confocal scan from a. The pinches above each nanopillar in a row are visible (corresponding to the green dotted line in c). c, Corresponding DIC image showing the locations of the nanopillars. d, The z position of the nuclear envelope can be localized precisely by fitting two Gaussian functions to the confocal z scan of the fluorescence signal at each pixel. Top panel: Confocal z scan of the fluorescence signal for a pixel on top of a nanopillar (location indicated by orange boxes in a and c). Bottom panel: Confocal z scan of the fluorescence signal for a pixel between nanopillars (location indicated by purple boxes in a and c). The fitted z positions of the basal nuclear envelope are illustrated by vertical green lines and the difference between the two z positions of the two pixels is evident. e, Nanopillar-induced nuclear deformation is clear in a reconstructed surface of the basal nuclear envelope. The value at each pixel is the height of the nuclear envelope, calculated as the centre of a Gaussian fit to the confocal z scan at that pixel. The nanopillars in this example have the following dimensions: 300 nm radius, 3 μm pitch and 2 μm height. Scale bars, 3 μm.

