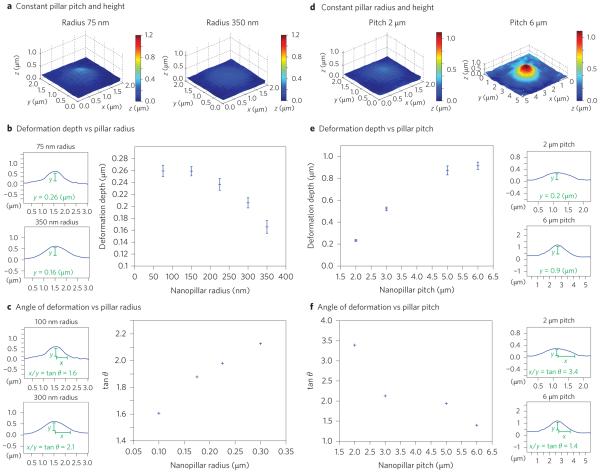
Figure 5. Nanopillar geometry determines the depth and shape of nuclear deformation.
a, At constant pitch, larger radii induce shallower, broader deformation. Reconstructed surfaces show the average deformation on nanopillar arrays with constant height (1.4 μm) and pitch (2 μm) but different radii: 75 nm (left) and 350 nm (right). b, The depth of deformation decreases with increasing nanopillar radius. The large plot shows the average depth of nuclear deformation versus nanopillar radius. The two small plots to the left show the profile through the centre of the indentation on 75 nm (top) and 350 nm (bottom) nanopillars, with the depth indicated. Height (1.4 μm) and pitch (2 μm) were held constant for all data points. c, The angle of deformation increases with nanopillar radius. The large plot shows the average angle of nuclear deformation versus nanopillar radius. The two small plots show the nuclear profile on 100 nm (top) and 300 nm (bottom) nanopillars, with the angle measurement indicated. Height (1.4 μm) and pitch (3 μm) were held constant for all data points. d, With the same radius, nanopillar arrays with larger pitch induce deeper, narrower deformation. Reconstructed surface showing average deformation on nanopillar arrays with constant height (1.4 μm) and radius (300 nm) but different pitch: 2 μm (left) and 6 μm (right). e, The depth of deformation increases with increasing pitch. The large plot shows average depth of nuclear deformation versus nanopillar pitch. The two small plots to the right show the nuclear profile for 2 μm (top) and 6 μm (bottom) pitch. f, The angle of deformation decreases with increasing pitch. The large plot shows the average angle of nuclear deformation versus nanopillar pitch. The two small plots show the nuclear profile for 2 μm (top) and 6 μm (bottom) pitch. Height (1.4 μm) and radius (300 nm) were held constant for all data points in e and f. The numbers of nanopillars and nuclei included in each sample are provided in Supplementary Table 1. Error bars indicate standard error of the mean.

