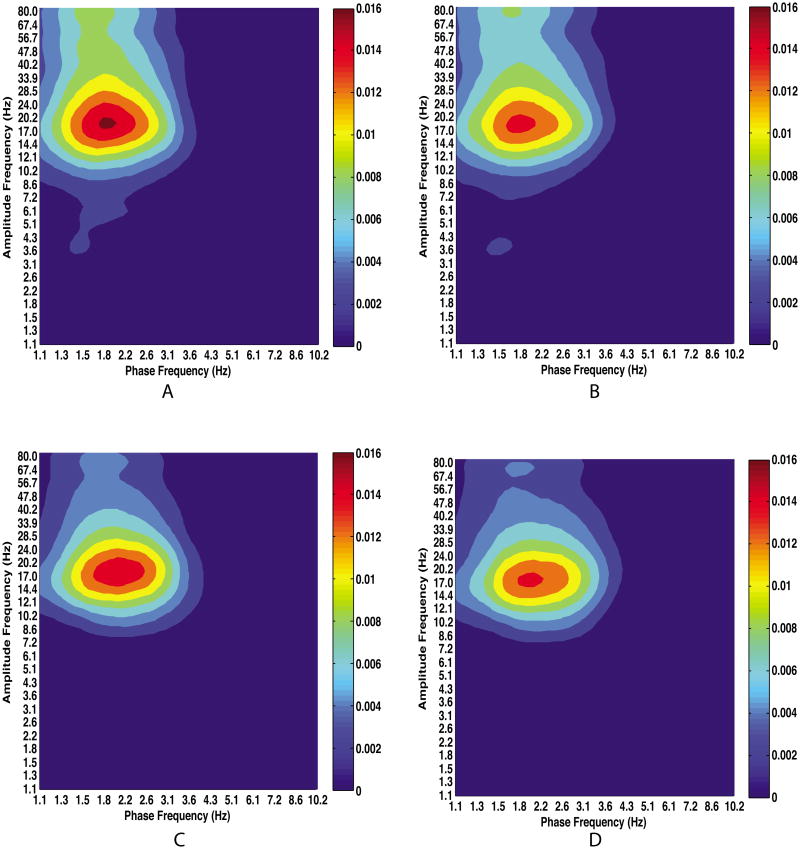
Figure 10.
Comodulograms showing CFC between all pairs of structures during anesthesia. Plots show corticocortical (A), corticostriatal (B), striatocortical (C), and striatostriatal (D) coupling. Note that CFC is strongest in frequency bands involved in striatocortical functional and effective connectivity reported elsewhere (Nakhnikian et al., 2014). All non-zero values are above chance at the 0.05 significance level.

