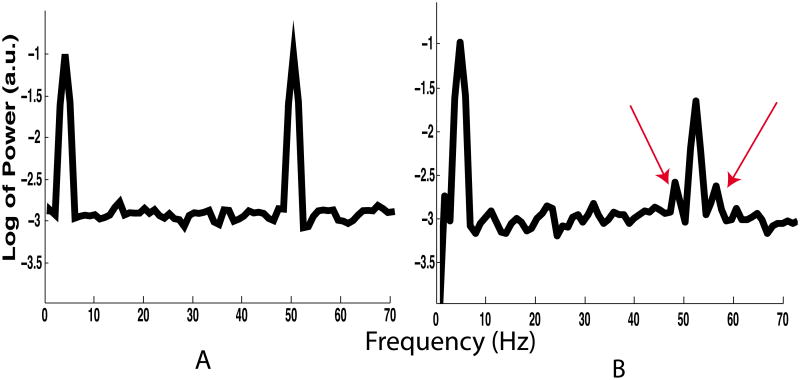
Figure 7.
Power spectral densities generated using simulated data in which CFC is absent (A) and present (B). Arrows in B indicate side-bands arising from CFC. The 4 Hz component modulates the 50 Hz component in B. The spectrum in Fig. 7 A was generated using the same simulated data analyzed to produce Fig. 6 C. Note that, although some MIs are above chance according to the permutation with FDR correction method, the power spectra corresponding to non-zero coupling do not show a clear modulator peak, nor side bands around the putative carrier frequency.

