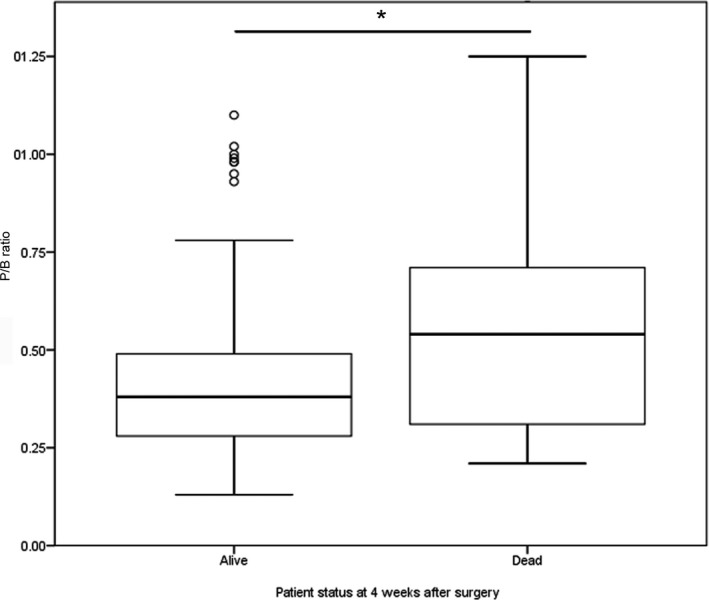
Figure 2.

Boxplots displaying the pituitary height/brain area (P/B) ratio of dogs alive (n = 275) and dead (n = 26) at 4 weeks after transsphenoidal hypophysectomy as treatment for pituitary‐dependent hypercortisolism. The P/B ratio of dogs that died within 4 weeks after surgery is significantly higher (*, P = .004). The box represents the interquartile range (i.e. from 1st to 3rd quartile), the line represents the median, the whiskers represent the highest and lowest value within 1.5× the interquartile range, ◦ indicates outlier.
