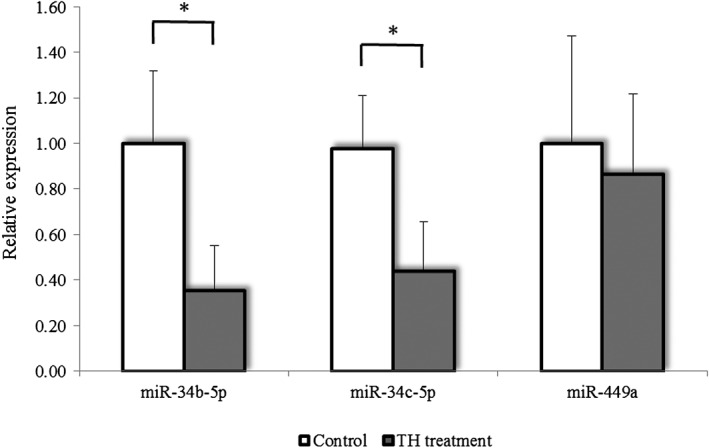
Figure 4.

Effect of testicular hyperthermia on the expression levels of testicular‐specific miRNAs in cynomolgus monkeys. The expression level of each miRNA in the testicular‐hyperthermia treated group expressed relative to that of the control group (normalized as 1). Data are shown as the mean ± SD (n = 3 per group). The asterisks (*) indicate statistical significance (P‐value < 0.05) by t‐test.
