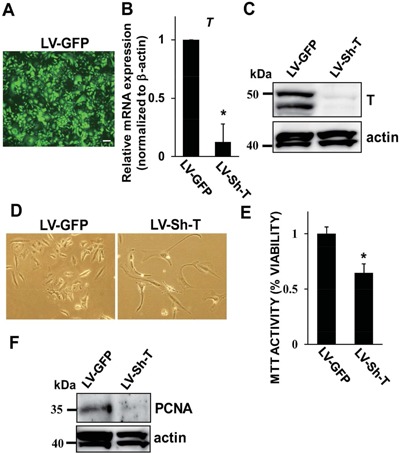
Figure 5.

Gene silencing of T suppresses the cell growth in U‐CH1‐N cells. (A) A photomicrograph of U‐CH1‐N cells transduced with LV‐GFP. Scale bar, 25 µm. (B) Assessment of gene silencing efficacy of T in U‐CH1‐N cells transduced with LV‐GFP or LV‐Sh‐T by quantitative RT‐PCR (B) and Western blot (C). Relative expression of the T transcripts in U‐CH1‐N cells transduced with LV‐GFP was normalized to that of β‐actin and set to one. (D) Photomicrographs of U‐CH1‐N cells transduced with LV‐GFP or LV‐Sh‐T. Magnification ×20. (E) Cell survival rate of U‐CH1‐N cells transduced with LV‐GFP or LV‐Sh‐T was evaluated using an MTT‐based assay. MTT activity of U‐CH1‐N cells transduced with LV‐GFP was set to one. (F) Western blot analysis of cell lysate collected from U‐CH1‐N cells transduced with LV‐GFP or LV‐Sh‐T. Data are represented as mean ± SEM of three independent experiments performed in triplicate (n = 3). *p < 0.05; ns, not significant.
