Figure 4.

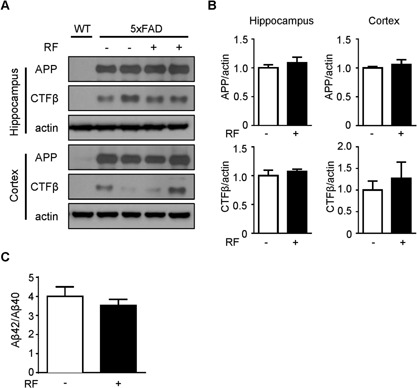
Effects of RF‐EMF exposure on protein levels of APP and CTFβ in Tg‐5xFAD mice. (A) Western blotting for APP and CTFβ using hippocampal and cortical extracts from 5xFAD mice following RF‐EMF exposure. A WT mouse was included for comparison. (B) Graph shows quantification of APP and CTFβ protein levels in 5xFAD mice (n = 6) based on band intensity. (C) Ratio of Aβ42/Aβ40 in plasma of 5xFAD mice was measured by colorimetric ELISA assay, and graph displays ratio of Aβ42/Aβ40 (n = 7–8). Values are presented as mean ± SEM.
