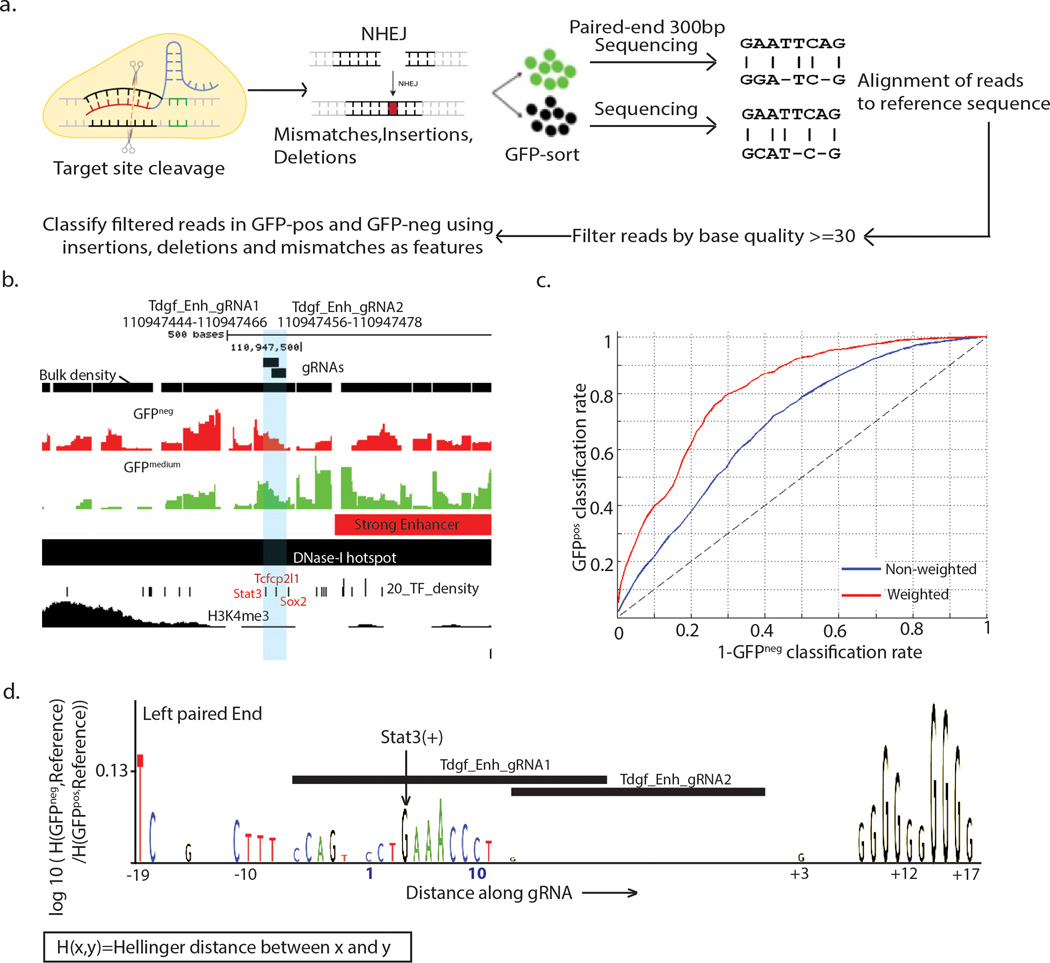
Figure 4. Functional motif discovery analysis of region-specific mutant genotypes at enhancers reveals required regulatory motifs.
(a) A schematic of the procedure involved in finding mutations induced by a particular gRNA (b) Plot showing the genomic regions surrounding two gRNAs at a proximal Tdgf1 enhancer region (gRNAs are shaded) showing overlap with DNase-I hotspot and predicted enhancer regions, and transcription factor binding sites Stat3, Tcfcp2l1 and Sox2. (c) ROC curve for fivefold classification of GFPneg and GFPpos genotypes using mutations within −20 to +20bp of the gRNA along left and right paired end reads as features. (d) Motif logo for region mutated by gRNAs with base scores computed as log-ratios of the hellinger distance of the GFPneg genotypes at a base to the reference base to the hellinger distance of the GFPpos genotypes at a base to the reference base, caused by Tdgf_gRNA_1 andTdgf_gRNA_2 along the left paired end read.

