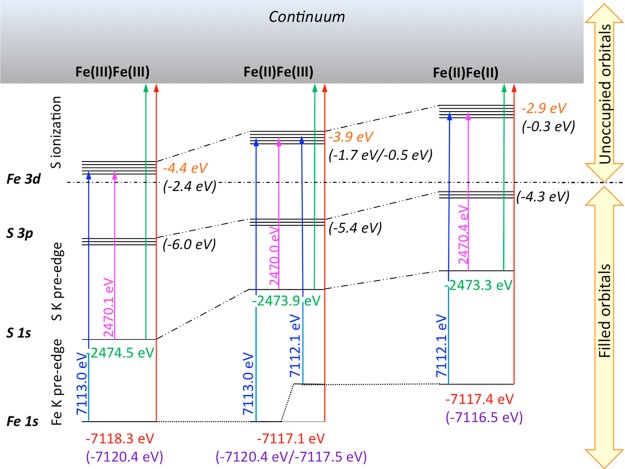
Figure 4.
Relative energies of the Fe 1s, S 1s, S 3p, and Fe 3d levels based on the Fe K- and S K-edge pre-edge and edge XAS transition energies. The arrows show the experimental energy for 1s to LUMO transitions for each model complex (written in pink for S and blue for Fe); the ionization energies (based on rising edge inflections) are written in red for Fe and green for S and marked with arrows. Calculated Fe 1s orbital energies (based on broken symmetry DFT calculations) are written in purple in parentheses. Together these results provide the average energies for the filled S 3p and empty antibonding Fe 3d molecular orbitals. The values derived from experiment are shown in orange italics, and the values from theory (based on broken symmetry DFT calculations) are given in black italics in parentheses.

