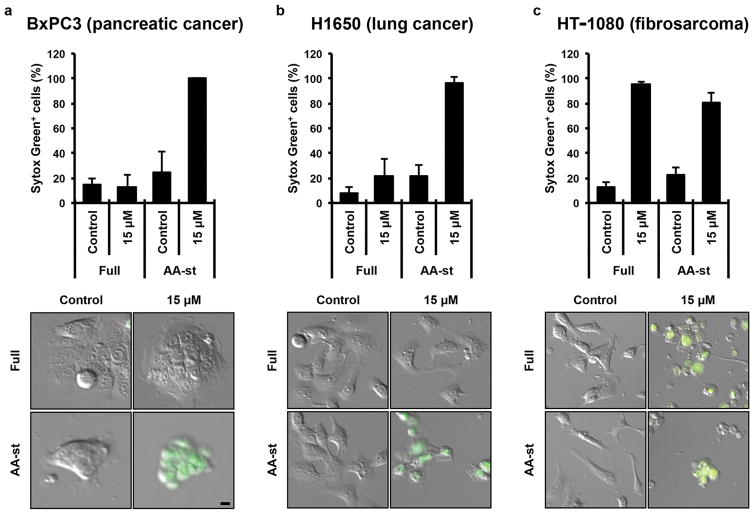
Figure 5. αMSH-PEG-C′ dots induce cell death in different types of cancer cells.
a–c, Quantification of cell death (Sytox green +) in (a) BxPC3 pancreatic carcinoma cells after 40 hours, (b) H1650 lung carcinoma cells after 45 hours and (c) HT-1080 fibrosarcoma cells after 65 hours, in full media (Full) or amino acid-free media (AA-st), in the presence or absence of 15μM αMSH-PEG-C′ dots. Error bars indicate mean+/-standard deviation. For parts a,b, N=5 per group. For part c, N=3 per group. Each replicate is from one biological experiment, quantified with five independent fields of view. Scale bars=10′m.

