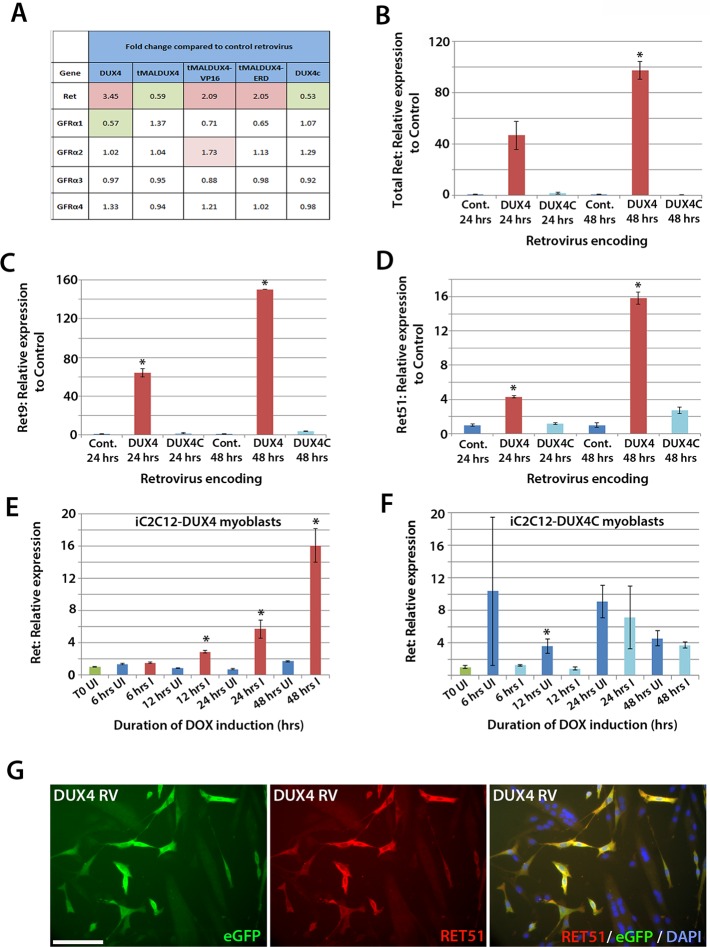
Figure 6. DUX4 expression induces Ret in satellite cell-derived myoblasts.
(A) Microarray data of expression levels of Ret and Ret co-receptors Gfrα1–4 in murine satellite cell-derived myoblasts transduced for 20 hr with retroviruses encoding either DUX4, truncated DUX4 (tMALDUX4), constitutively active DUX4 (tMALDUX4-VP16), dominant-negative DUX4 (tMALDUX4-ERD) or DUX4c (Banerji et al., 2015). Red highlights increased expression while green highlights reduced expression (fold change) compared to transduction with control retrovirus. (B–D) Quantification of total Ret, Ret9 and Ret51 expression by RT-qPCR in satellite cell-derived myoblasts transduced with DUX4, DUX4c or control retroviruses at 24 and 48 hr post-infection. (E–F) Ret expression in iC2C12-DUX4 myoblasts (E) and iC2C12-DUX4c myoblasts (F) following 200ng/ml doxycycline (DOX) induction. (G) Satellite cell-derived myoblasts transduced with DUX4-encoding retrovirus for 24 hr and immunolabelled for eGFP (green) to identify transduced cells and anti-RET51 (red), with a DAPI counterstain (blue). Data is mean ± SEM from 3 independent experiments using 3 mice for (B–D) where statistical difference (p<0.05) from transduction with control retrovirus was assessed using a paired Student’s t-test and denoted by an asterisk. For E and F , unpaired Student's t-tests were used to assess significance (p<0.05) compared to uninduced cells at each time point. UI = un-induced, I = induced by doxycycline. Scale bar equals 100 µm (G).

