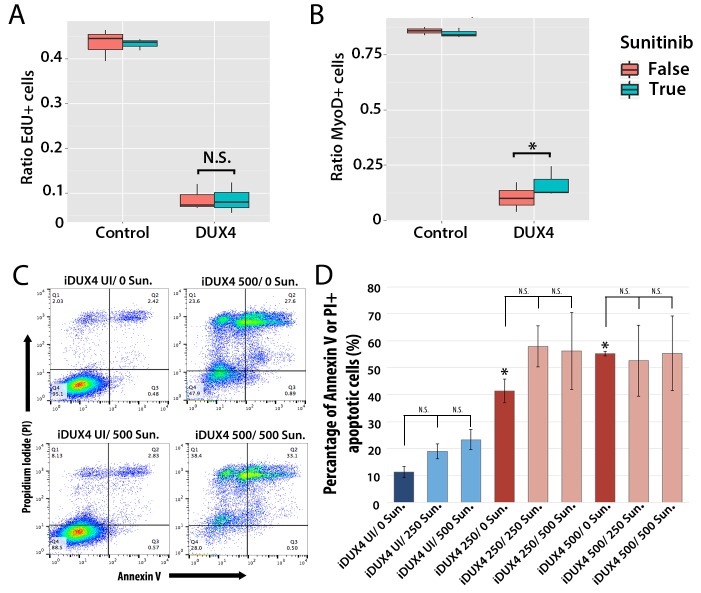
(A–B) Quantification of murine satellite cell-derived myoblasts transduced with control or DUX4-encoding retrovirus and treated with either 250 ng/ml Sunitinib (blue) or DMSO vehicle control (red). Cells were cultured at low density and incubated in proliferation medium prior to immunolabelling to detect eGFP and either EdU (A) or MyoD (B). The ratio represents the proportion of cells with EdU (A and Figure 9—source data 1) or MyoD (B and Figure 9—source data 2) labelling in the presence (True, blue), or absence of Sunitinib (False, red). Bar represents statistical test significance, where an asterisk denotes p<0.01 or N.S. means non-significant.(C) FACS analysis of murine iC2C12-DUX4 myoblasts cultured in control medium (UI) or induced to express DUX4 with 250 ng/ml or 500 ng/ml doxycycline and untreated (0), or exposed to 250 ng/ml or 500 ng/ml Sunitinib for 24 hr. (D) Quantification of the mean proportion of apoptotic iC2C12-DUX4 myoblasts based upon the expression of Annexin V and propidium iodide (PI). As a control, an asterisk denotes increased apoptosis by DOX-mediated induction of DUX4 compared to un-induced cells (all without Sunitinib treatment). An average of 3 independent experiments, where statistical difference to myoblasts not exposed to Sunitinib at each concentration of doxycycline was tested using an unpaired two-tailed Student t-test, where p<0.05 represents significance (*).
DOI:
http://dx.doi.org/10.7554/eLife.11405.013
Figure 9—Source data 1. Maximum likelihood parameters for a logistic model containing an interaction term, and a random effect term (the mouse) that describes the proportion of myoblasts transduced with DUX4 or control retrovirus and incorporating EdU when exposed to Sunitinib or DMSO.(a) Maximum likelihood parameters for a logistic model containing an interaction term, and a random effect term (the mouse) that describes the proportion of myoblasts incorporating EdU transduced with DUX4 or control (MIG) retrovirus when exposed to Sunitinib or DMSO. y represents the probability of EdU incorporation. µ represents the intercept parameter (representing the control treatment: MIG control retrovirus with no drug), β are the parameters representing the effects of each treatment, or the interaction as specified and δ indicates whether the effect is present or absent. (b) Corresponding log of odds ratios computed from the model, for all 4 tested conditions.
Figure 9—Source data 2. Maximum likelihood parameters for a logistic model containing an interaction term, and a random effect term (the mouse) that describes the proportion of cells transduced with DUX4 or control retrovirus and expressing MyoD when exposed to Sunitinib or DMSO.(a) Maximum likelihood parameters for a logistic model containing an interaction term, and a random effect term (the mouse) that describes the proportion of cells expressing MyoD transduced with DUX4 or MIG control retrovirus when exposed to Sunitinib or DMSO. y represents the probability of MyoD expression. µ represents the intercept parameter (representing the control treatment: MIG control retrovirus with no drug), β are the parameters representing the effects of each treatment, or the interaction as specified and δ indicates whether the effect is present or absent. (b) Corresponding log of odds ratios computed from the model, for all 4 tested conditions.

