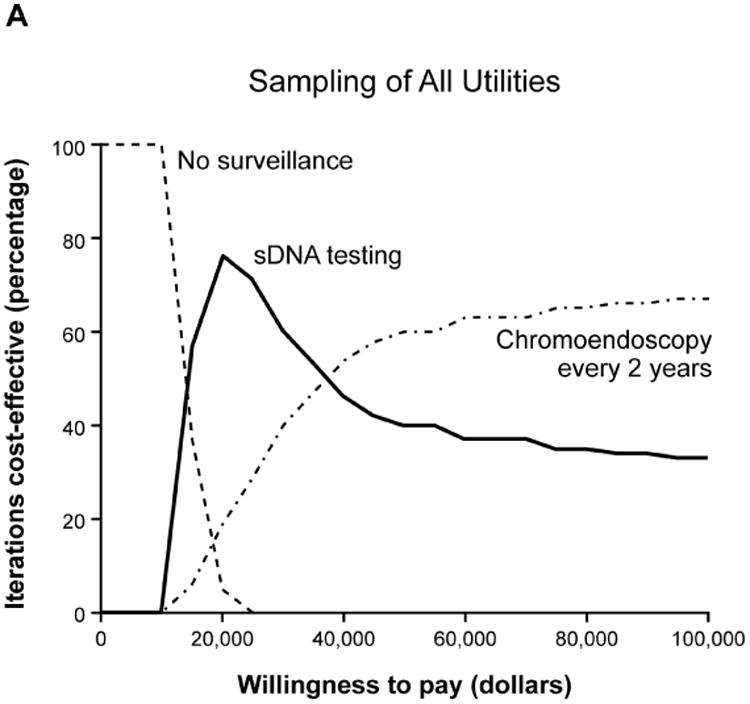
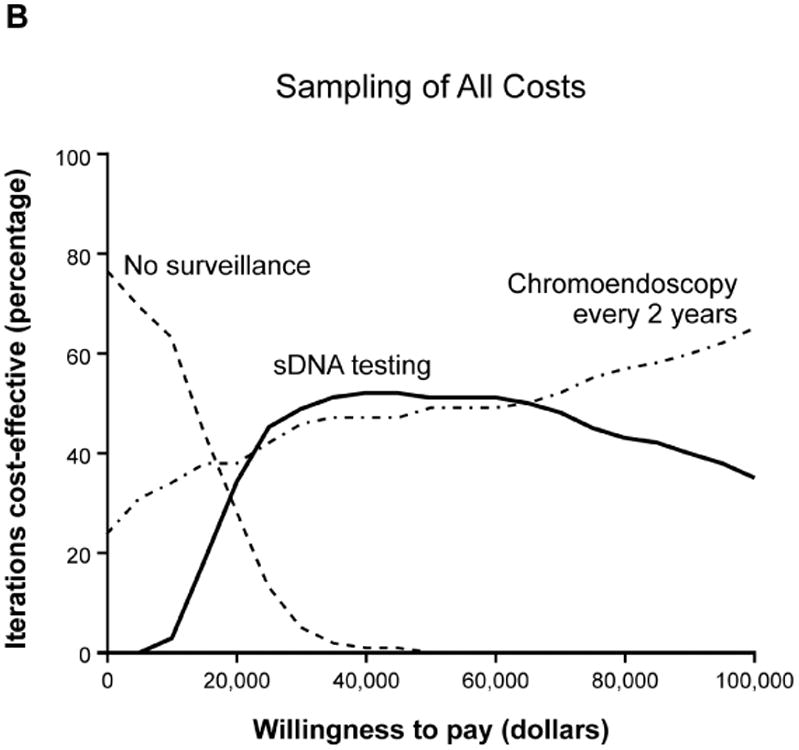
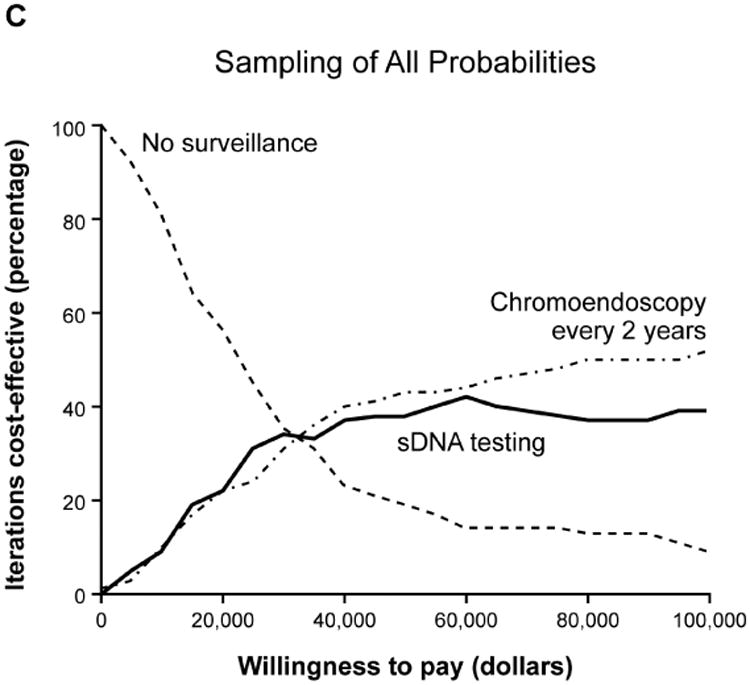
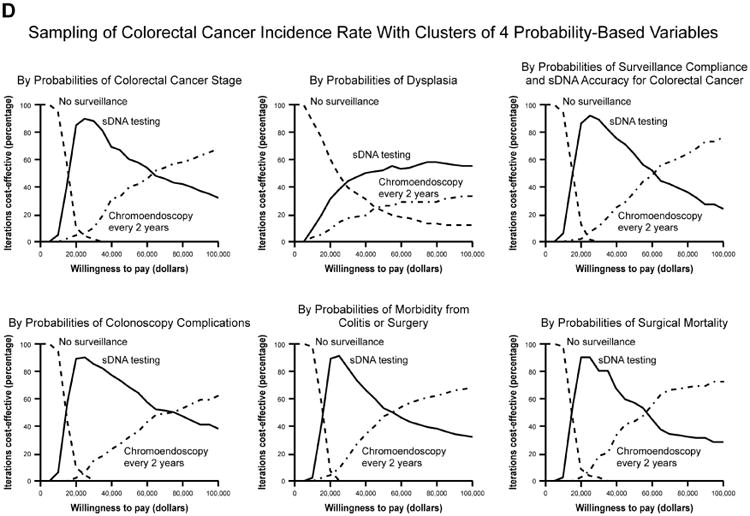
Figure 4.


Acceptability curves for the each of the major input variable categories (A) utilities, (B) costs and (C) probabilities. Probabilities were further examined in smaller clusters of variables at a time (D) which all met base-case expectations.
