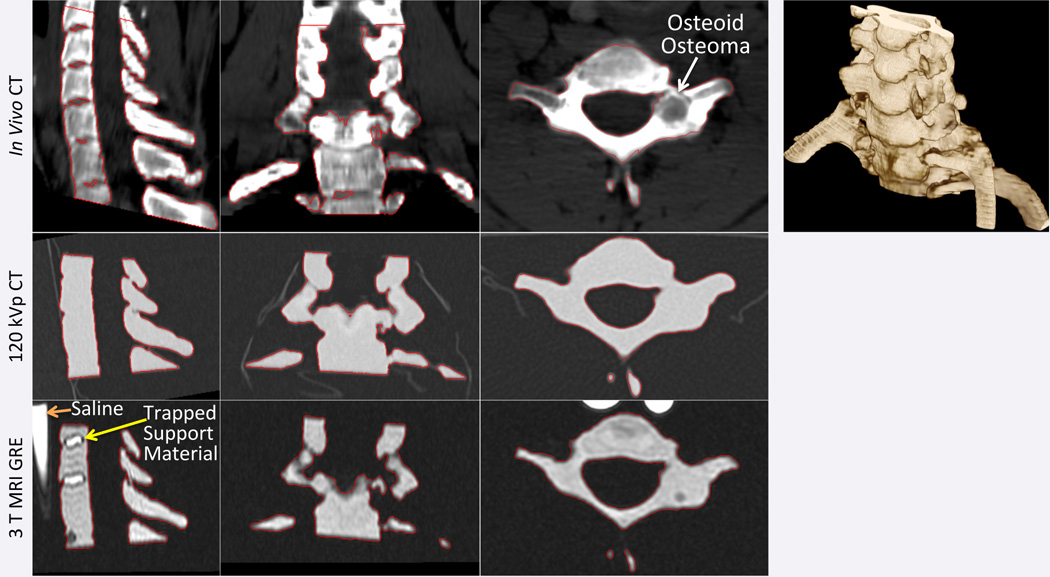
Figure 1.
Source CT images and volume rendering (top row) of cervical spine with a C7 right pedicle osteoid osteoma (white arrow in axial plane) show the segmentation used to produce the STL model (red outline in source images). CT (middle row) and MR (bottom row) images of the printed phantom are shown at matching planes with the segmentation of the phantom from each modality also outlined. Trapped support material in certain regions in between vertebrae that were enclosed by bone are visible in the printed model with MRI but not CT.

