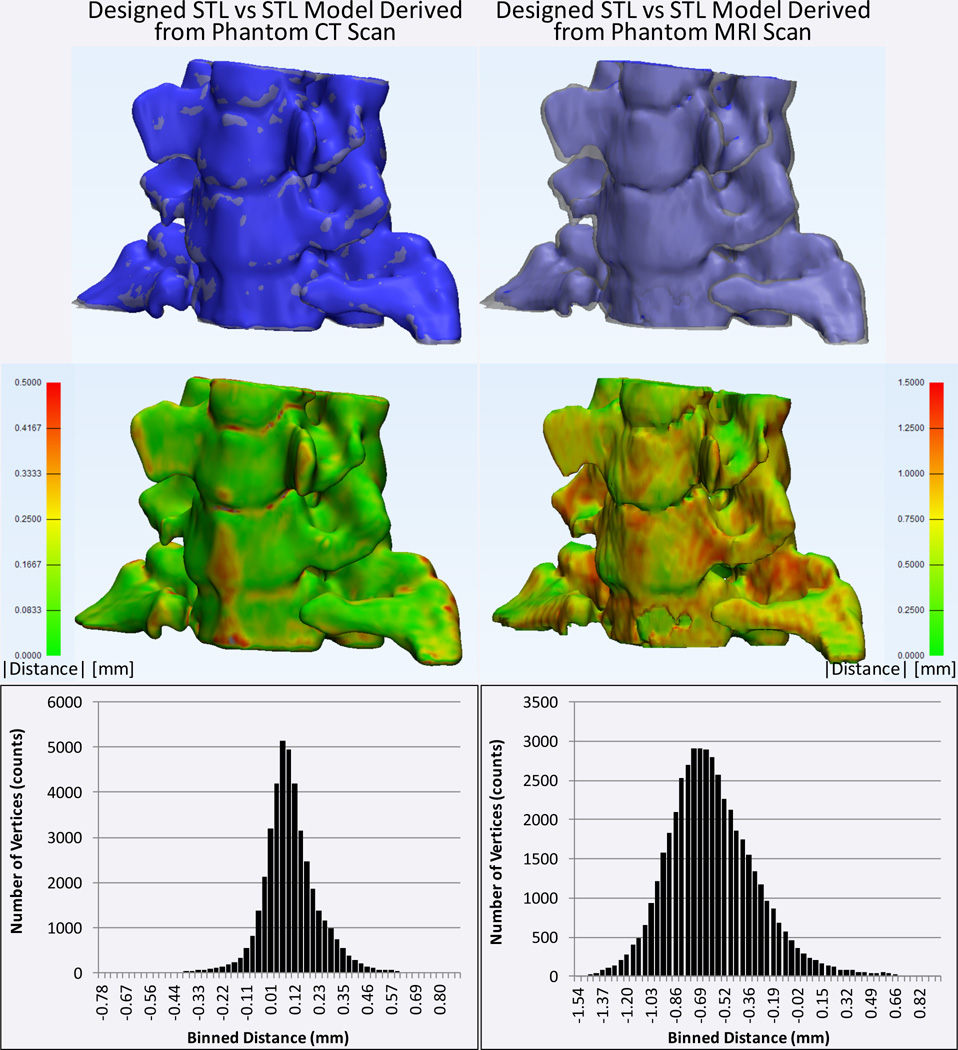
Figure 3.
Comparison of STL models obtained by segmentation of CT (left column) and MRI (right column) scans of the printed model to that initially derived from the patient CT images. Top row: the CT- and MRI-derived models are shown in blue and the STL model designed from the patient scan is shown in translucent gray. Middle row: absolute distance between the designed model and the models derived from the CT and MRI of the phantom are shown color-coded (green=0 mm to red≥1.5 mm). Bottom row: histograms of the minimum unsigned distances from each vertex of the original model to the surface of the models derived from the CT and MRI of the phantom.

