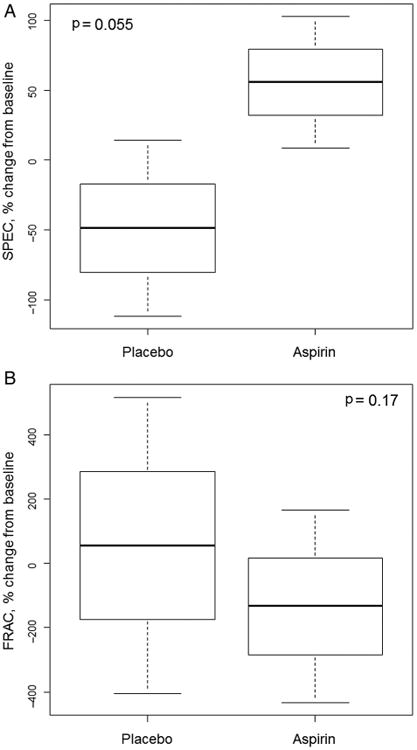
Figure 2.

Plots of spectral markers for subjects treated with aspirin or placebo are shown as box plots of per cent changes in spectral slope (SPEC) (A) and fractal dimension (FRAC) (B) values at 3 months post-treatment with aspirin or placebo compared with baseline values, depicting mean (middle line), SD (box) and 95% confidence limits (whiskers). During field carcinogenesis, SPEC typically decreases and FRAC increases, so the data demonstrate a reversion towards less neoplastic signatures by aspirin.
