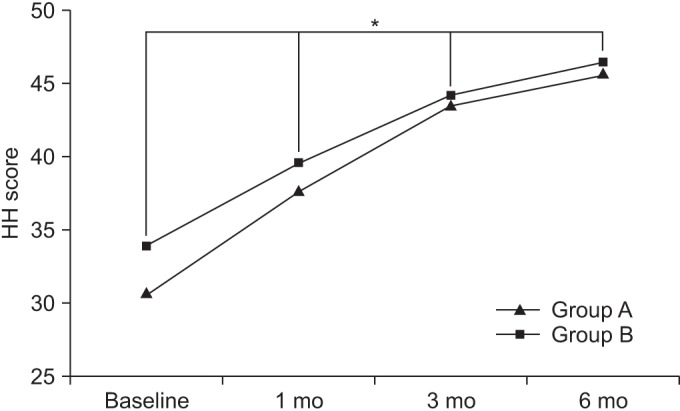
Fig. 3. The Harris hip (HH) score at baseline and at 1-, 3-, and 6-month follow-ups after extracorporeal shock wave therapy in both groups. This figure shows significant improvement in the HH score in both groups, for the entire period (*p<0.05 for time effect, *p<0.05 for group-time interaction). Group A, 0.12 mJ/mm2 energy group; group B, 0.32 mJ/mm2 energy group.

