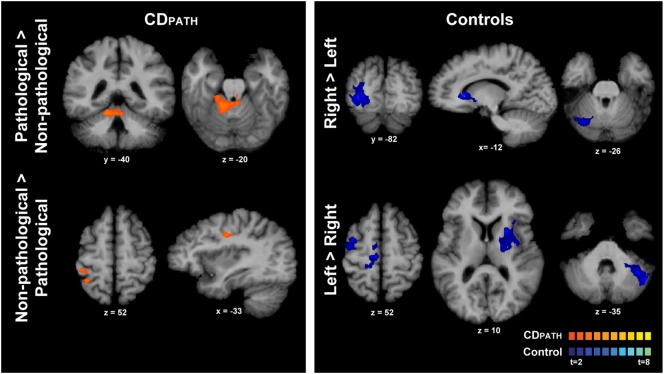
Figure 4.
Within-group comparisons of isometric head rotation in different directions in CDPATH and controls. Areas with significant activation are represented in orange for CDPATH and in blue for controls (p < 0.05, random effects analysis with cluster-correction). The images on the top row show regions with greater activity for the direction of torticollis in comparison to the non-pathological direction (or head rotation right in comparison to left in controls). The images on the bottom row show results for regions with greater activity for non-pathological direction of head movement in comparison to the pathological direction (or head rotation left in comparison to right in controls). Color t-scales for each group are shown on the lower right corner. CDPATH, cervical dystonia group normalized to the direction of pathological movement; R, right.

