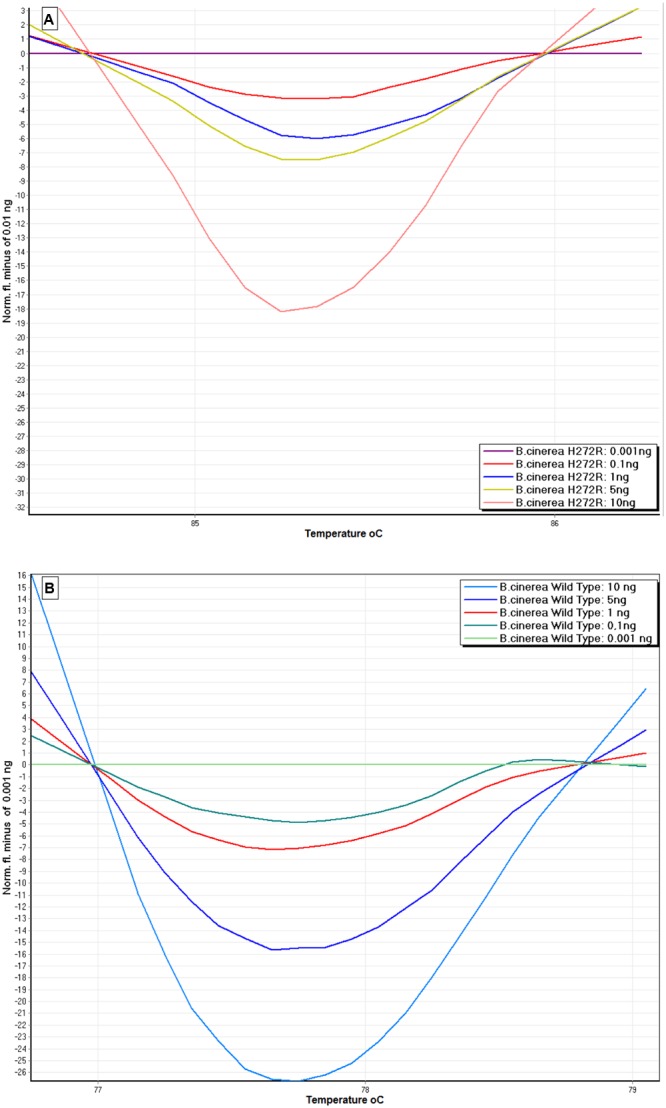
FIGURE 4.

Sensitivity of HRM assay to detect DNA of a B. cinerea isolate possessing the H272R mutation (A) and a wild-type isolate (B). Difference curves were generated using 0.1–10 ng DNA per reaction tube. 0.001 ng of genomic DNA from B. cinerea was used as reference baseline curve.
