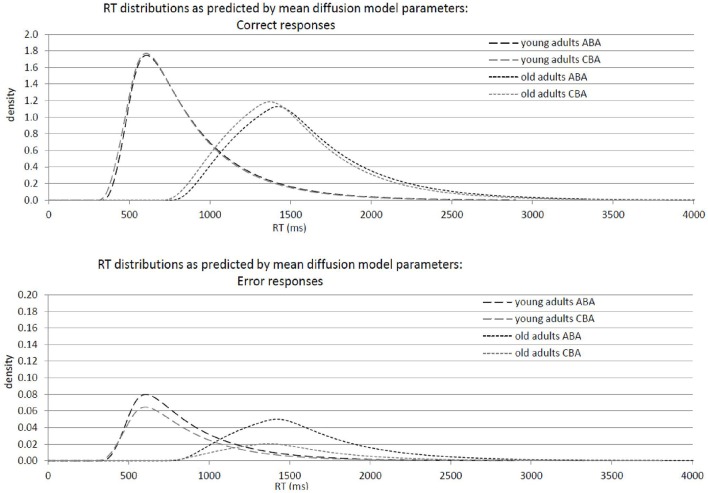
Figure 3.
Graphical illustration of response-time distributions resulting from mean diffusion model parameters in ABA and CBA conditions in young adults (18–26 years; N = 22) and older adults (64–79 years; N = 18). Upper panel: Distribution of correct responses. Lower panel: Distribution of error responses.

