
Figure 2.
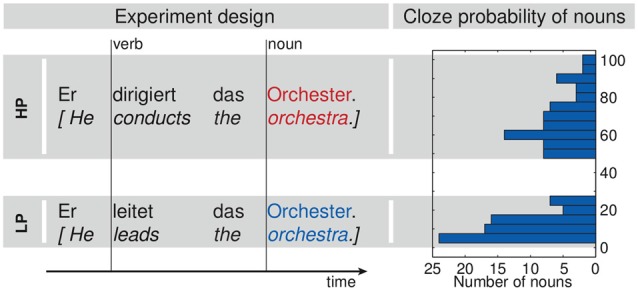
Experimental design. The left part shows two exemplary sentences out of the set of 69 pairs. Vertical lines mark the acoustic onsets of the verbs and nouns as used for the analysis. The histogram at the right shows the distribution of the cloze probability values for the nouns in both conditions.