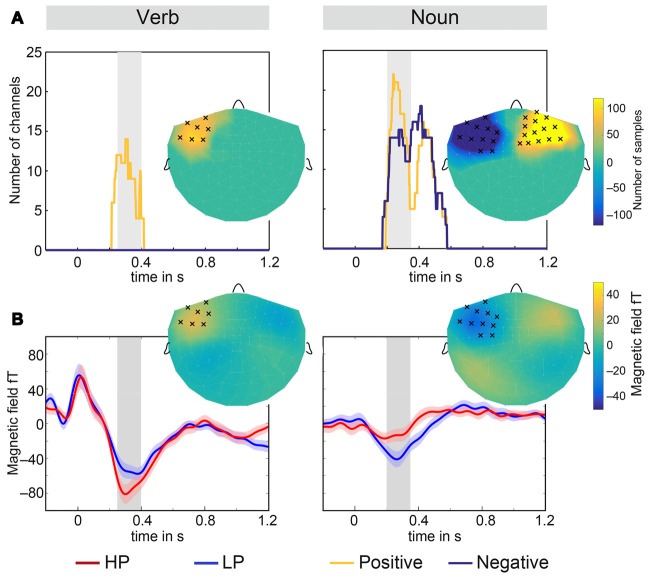
Figure 4.
Results of the cluster analysis. (A) Spatio-temporal extent of the three clusters for verbs (left) and nouns (right). The gray bar in the background marks the temporal intervals which were used throughout this article. The inserts show topographically the full number of samples in a cluster. Channels which had 50 or more cluster samples within the gray intervals were marked by crosses. (B) Average time courses of left hemispheric magnetometers in clusters for verbs and nouns and both conditions LP and HP. The shaded area around the solid lines displays the standard error of the mean. The inserts show topographically the magnetic field difference LP-HP averaged over the time interval marked in gray. Marked channels have 50 or more cluster samples within the gray interval.

