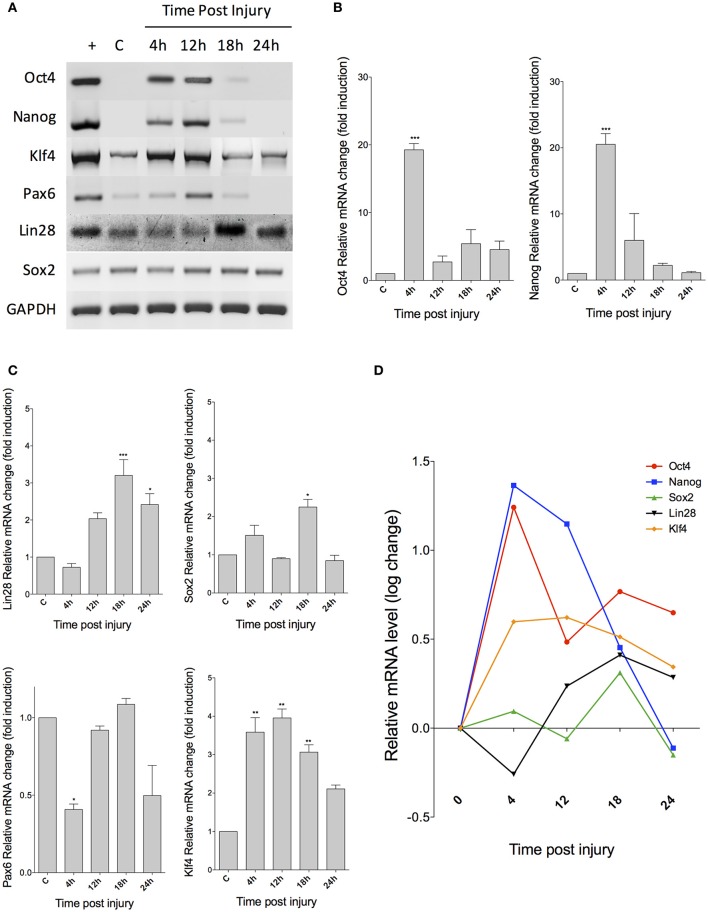
Figure 2.
Expression of pluripotency-associated markers in injured retina. (A) RT-PCR analysis reveals the changes in expression of several markers at the indicated times after injury. C, control; +, embryonic cDNA as positive control. (B) Real-time PCR quantification of Oct4 and Nanog expression levels (C) qPCR analysis for Lin28, Sox2, Pax6, and Klf4. (D) Change dynamics for all markers after a logarithmic transformation of data to allow a better visualization of the expression pattern for each gene. (ANOVA: ***p < 0.001; **p < 0.01; *p < 0.05).

