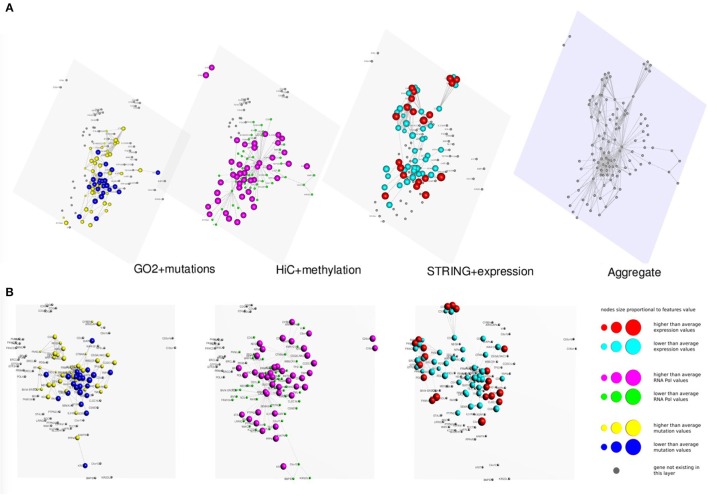
Figure 3.
Multi-layer graph for the breast cancer cell line MCF-7 at time point 0 h, before E2 stimulation, considering ESR1 as seed gene. (A) represents the stacked multilayer (interlayer edges have been removed for readability), while (B) shows each single layer separately. In both panels, from left to right, the first layer represents the functional similarity of genes relying on the BP domain of GO, as computed by InteGO2. On this network, breast cancer mutation data are mapped, according to the COSMIC database (colors and dimensions of nodes indicate the number of samples with mutations in the COSMIC dataset for each gene). The second layer represents the conformation of the chromatin in the nucleus, according to Hi-C experiments analyzed using NuChart. Vertices are colored according to the methylation of genes, relying on MeDIP-seq experiments. The third layer represents a protein-protein interaction network according to the data reported in the STRING database. Gene expression data have been mapped on this graph and vertices are represented accordingly. Please note that in each layer genes are mapped always in the same positions, according to the representation achieved in the fourth level of (A), in which all genes are aggregated and the Fruchterman–Reingold is performed to achieve the optimal distribution of vertices.

