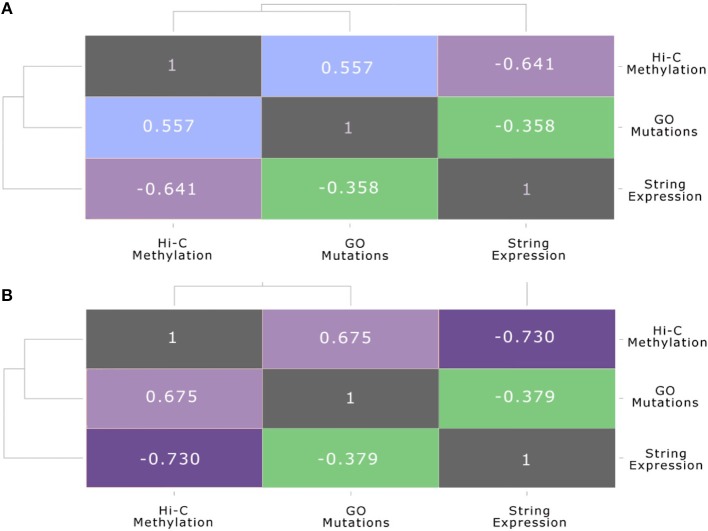
Figure 7.
Multi-layer correlation. This figure shows the correlation between each pair of layers, before and after the stimulation, calculated using the Spearman correlation coefficient between the strength of nodes and their counterparts in the other layers. In particular: (A) shows the inter-layer Pearson correlation (Spearman correlation is reported in brackets) before the stimulation: (B) shows the inter-layer Pearson correlation (Spearman correlation is reported in brackets) after the stimulation.

