Fig. 2.

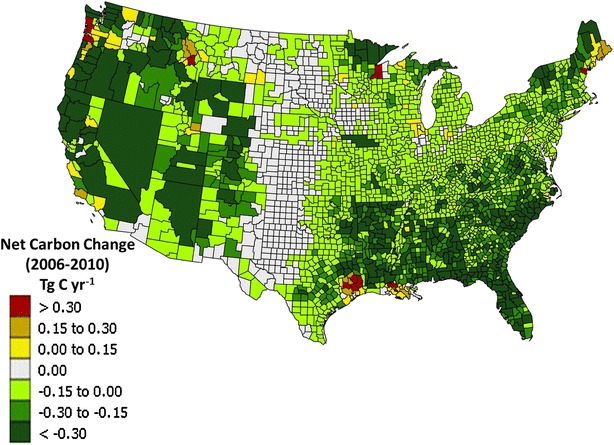
Average annual net carbon change (Tg C year−1) at the combined county scale across the CONUS. Most combined counties (91%) are net C sinks while areas with extensive forest disturbance can be net C sources to the atmosphere

Average annual net carbon change (Tg C year−1) at the combined county scale across the CONUS. Most combined counties (91%) are net C sinks while areas with extensive forest disturbance can be net C sources to the atmosphere