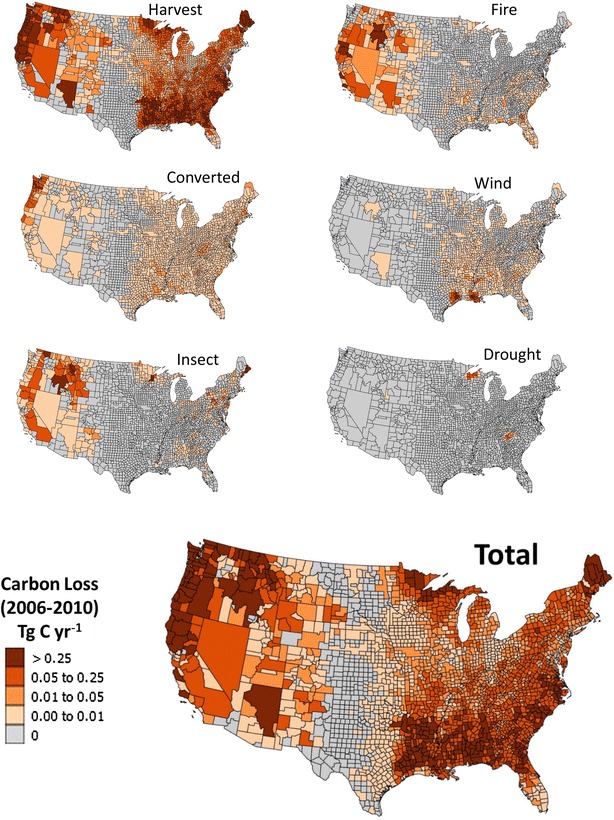
Fig. 3.

Average annual net carbon loss (Tg C year−1) attributed to the most likely disturbance type and estimated at the combined county scale for harvest, fire, land use conversion, wind, insect, and drought. Combining these six sources results in estimates of total annual net C loss from disturbance occurring between 2006 and 2010
