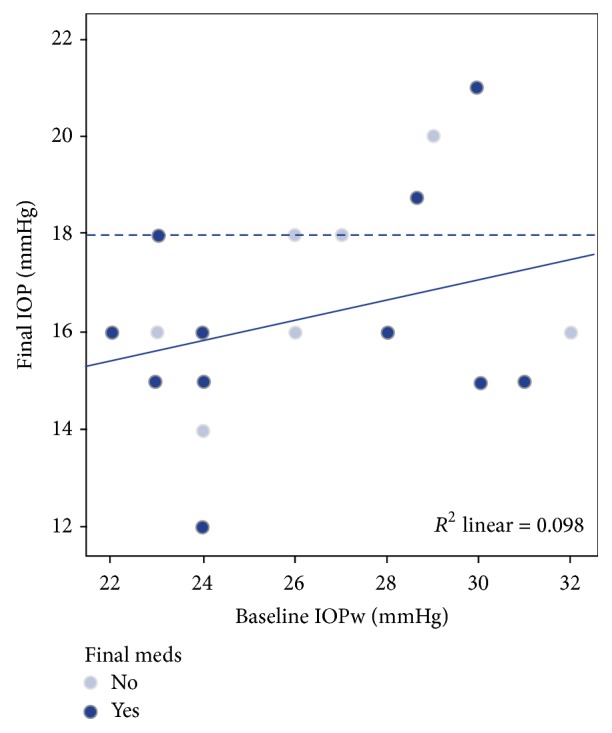
Figure 2.

Scatter plot representing preoperative intraocular pressure (IOP) after washout and postoperative IOP without and with meds. Continuous line represents regression line (R 2 = 0.098). Discontinuous line represents IOP of 18 mmHg, defined as success in the study.
