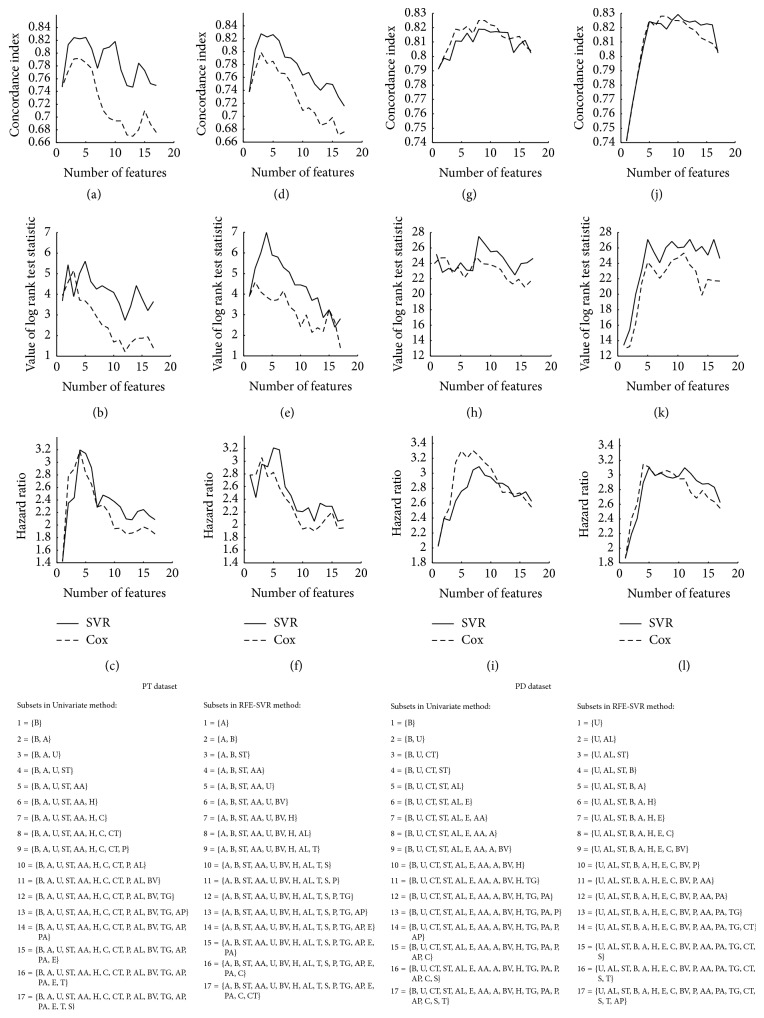
Figure 2.
Performance measures of linear SVR and Cox for different subsets of features. (a), (b), and (c): performance measures of univariate method for PT dataset. (d), (e), and (f): performance measures of RFE for PT dataset. (g), (h), and (i): performance measures of univariate method for PD dataset. (j), (k), and (l): performance measures of RFE for PD dataset. B: bilirubin, A: age, U: urine copper, ST: stage, AA: aspartate aminotransferase, H: presence of hepatomegaly, C: cholesterol, CT: standardized blood clotting time, P: platelet count, AL: albumin, BV: blood vessel malformations in the skin, TG: triglycerides, AP: alkaline phosphatase, PA: presence of ascites, E: edema, T: treatment, and S: sex.

