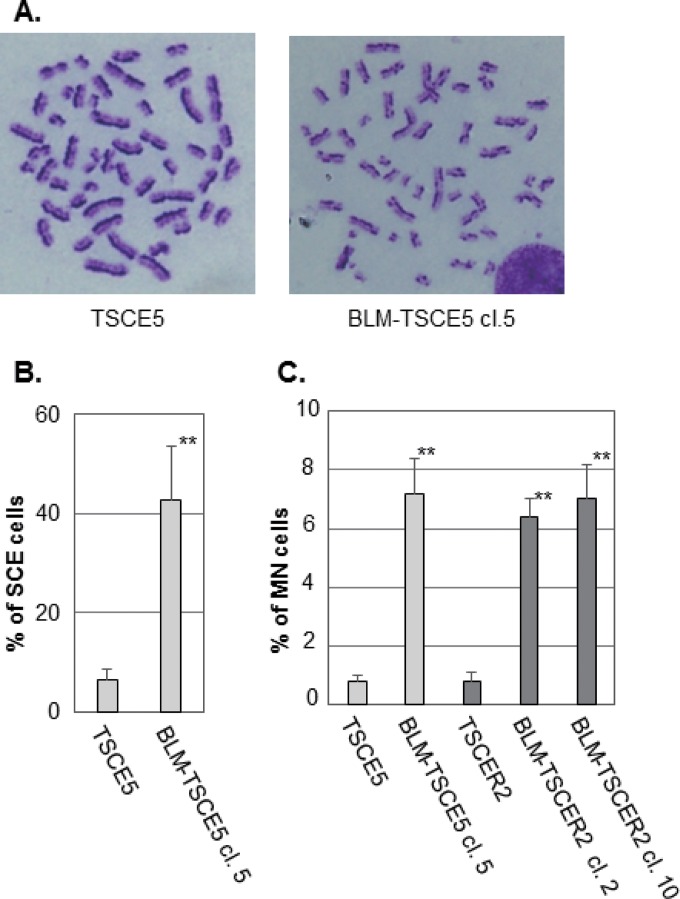
FIG 2.
(A) Representative images of metaphase spreads from TSCE5 and BLM-TSCE5 cells used in the sister chromatid exchange (SCE) analysis. (B) Frequencies of spontaneous SCE in TSCE5 and BLM-TSCE5 cells. (C) Frequencies of spontaneous micronucleus formation in TSCE5 and TSCER2 cells and their BLM-deficient clones. The data are presented as means and standard deviations (SD) for three independent experiments. **, P < 0.01.

