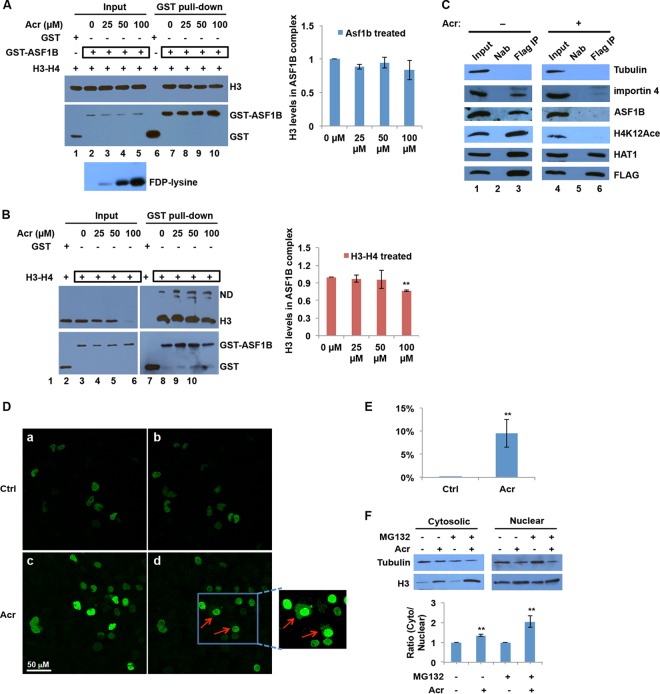
FIG 5.
Acr inhibits nuclear import of histones by disrupting the interaction between histones and their translocator protein. (A, B) Effects of Acr modification on the interaction between ASF1B and histones in vitro. GST-ASF1B was treated with Acr, mixed with H3-H4 tetramers, and then subjected to GST pulldown assays, followed by Western blotting with the antibodies indicated (A). H3-H4 tetramers were treated with Acr and then mixed with GST-ASF1B and subjected to GST pulldown assays (B). Bar graphs showing relative quantification of histone H3 levels in GST pulldown samples normalized to ASF1B. The data shown are the mean values ± SD from three independent experiments. **, P < 0.01. (C) Disruption of association of histones with a histone chaperone and a translocator protein in cells exposed to Acr. BEAS-2B cells that stably express FLAG-tagged histone H3 were treated with 100 μM Acr for 2 h or not treated with Acr. Cytosolic fractions were isolated and subjected to FLAG IP, followed by Western blotting with the antibodies indicated. Nab, no antibody (negative control). (D, E) Acr exposure inhibits the nuclear import of nascent histones. (D) Time-lapse experiments were performed to study the effects of Acr on nascent histone nuclear import. EGFP-H3 expression was induced overnight in inducible UTA6-EGFP-H3 cells. The cells were treated with 20 μM MG132 for 2 h and then treated with 100 μM Acr for an additional 2 h (Acr) or not treated with Acr (Ctrl). The cellular distribution of EGFP-H3 was monitored with an immunofluorescence confocal microscope. (a, b) Untreated UTA6-EGFP-H3 cells at 0 (a) and 120 (b) min. (c, d) Acr-treated UTA6-EGFP-H3 cells at 0 (c) and 120 (d) min. Newly synthesized EGFP-H3 was retained in the cytoplasm following Acr exposure, as indicated by the red arrow. (E) Percentages of cells with retained GFP signals in the cytoplasm. The number of cells with EGFP-H3 retained in the cytoplasm was determined and divided by the total cell number. The data shown are the mean values ± SD from four independent experiments. **, P < 0.01. (F) Ratio of cytosolic to nuclear H3 distribution following Acr exposure. Cells were treated or not treated with MG132 before and after Acr exposure. The cytosolic and nuclear fractions were extracted and subjected to Western blot analysis with H3 antibodies. Band intensities were quantified with ImageJ software. Each column shows the ratio of the H3 level in the cytoplasm to that in the nucleus. The data shown are the mean values ± SD from four independent experiments. **, P < 0.01.

