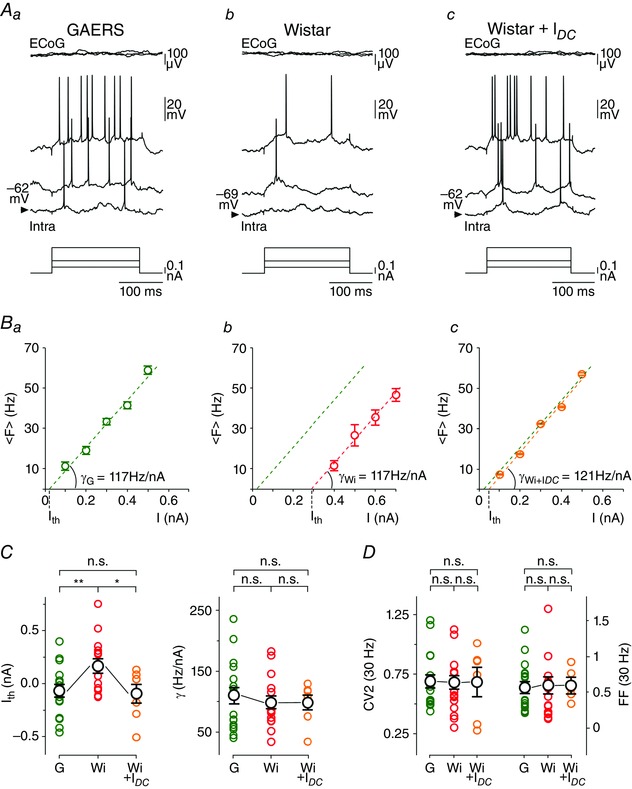
Figure 3. GAERS S1 cortex neurons exhibit in between seizures an increased sensibility to weak excitatory inputs .

Aa–c, current‐evoked (bottom traces) voltage responses (Intra) recorded from S1 cortex neurons in GAERS during inter‐ictal period (Aa) and in a control Wistar rat at V m (Ab) and during DC depolarization (Ac). Superimposed top traces are the simultaneous recorded ECoG activity. Ba–c, corresponding F–I curves from the neurons illustrated in A. Each symbol corresponds to the mean (± SEM) firing rate from 20–25 successive trials. Values of the neuronal gain (γ) and threshold current (I th) calculated in GAERS (G) and Wistar rat neurons in control (Wi) and during DC depolarization (Wi + I DC) are indicated. The green dashed line in Ba–c is the linear fit of the F–I curve computed in the GAERS neuron. C, population data of neuronal sensitivity (I th) and gain (γ) for neurons recorded in GAERS (G, green circles), control Wistar rats in control condition (Wi, red circles) and during DC depolarization (Wi + I DC, orange circles). D, pooled data comparing Fano factor (FF) values of spike counts and mean CV2 of ISIs between GAERS (G) and Wistar rat neurons at V m (Wi) and during artificial depolarization (Wi + I DC). Measurements were made on current pulses evoking on average a firing rate of 30 Hz. * P < 0.05; ** P < 0.01; n.s., non‐significant.
