
Figure 5. The W‐component is associated with an increase in the membrane input resistance of cortical neurons .
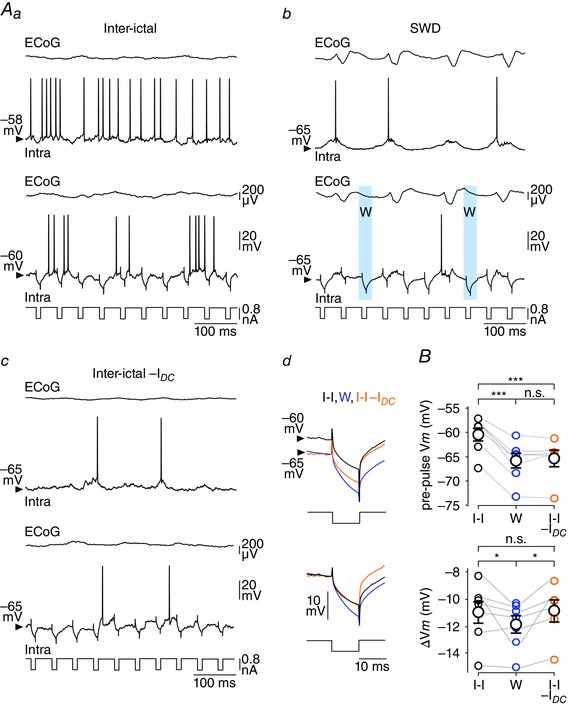
A, coupled recordings of S1 cortex ECoG and intracellular activities in between SWDs (Aa), during seizure activity (Ab) and during an inter‐ictal period associated with DC hyperpolarization (I DC = −0.3 nA) to approach the minimal V m reached during the seizure. Differences in membrane conductance between these three conditions were assessed from voltage responses (bottom records) to negative (−0.8 nA) current pulse injections (lowest traces). Examples of cell responses obtained during the W‐component are shaded blue in Ab. Ad, DC superimposition of the average current‐evoked voltage changes obtained during the inter‐ictal period (I‐I, black trace, n = 1250 responses), the W‐component (W, blue trace, n = 152 responses from 12 SWDs) and DC hyperpolarization in between seizures (I‐I –I DC, orange traces, n = 224 responses). The bottom panel illustrates the same three records superimposed by matching the V m before the start of the pulse. B, population data showing the mean V m values calculated just before the onset of current injection, during inter‐ictal period (I‐I), the W‐component (W) and DC hyperpolarization during inter‐ictal period (I‐I–I DC) (top). The bottom graph shows the corresponding values of current‐induced voltage deflections (ΔV m). Here and in the following population graphs, the grey lines connect measurements made from the same neurons. * P < 0.05; *** P < 0.001; n.s., non‐significant.