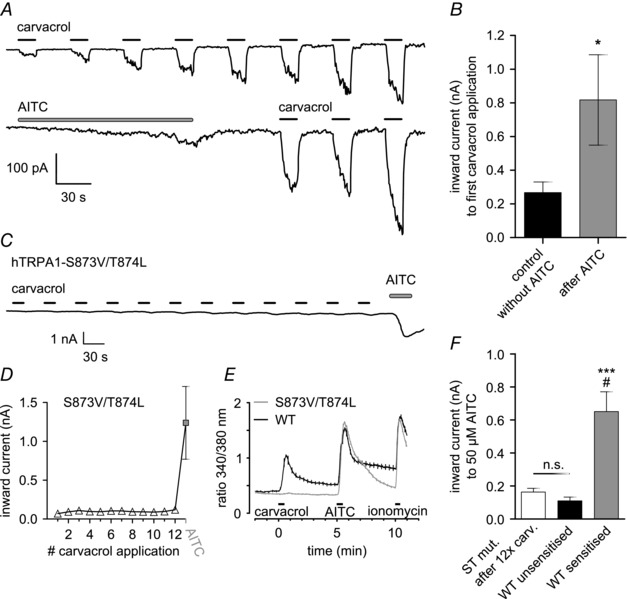
Figure 4. Different agonists cross‐sensitise .

A, representative voltage‐clamp recordings in hTRPA1‐expressing HEK293t cells, showing cross‐sensitisation between AITC and carvacrol. Top: sensitisation of inward currents induced by carvacrol (100 μm; 15 s; 30 s gap). Bottom: recording in identical conditions but TRPA1 activated with AITC (50 μm; 150 s) before application of carvacrol. B, cross‐sensitisation of response to carvacrol by AITC. First carvacrol‐induced response is significantly larger following exposure to AITC (P = 0.016; n = 8 for AITC group, n = 24 for control). C, mutation S873V/T874L abolishes responses to carvacrol but not AITC. Representative recording (see Fig. 1 for protocol) in HEK293t cells expressing the hTRPA1‐S873V/T874L mutant. No response to carvacrol was observed. AITC 100 μm was applied at the end of the protocol and response was of normal amplitude. D, quantification of C, plotting the average inward current for each agonist application (n = 9). E, ratiometric calcium imaging confirms deletion of carvacrol response in hTRPA1‐S873V/T874L mutant. Experiments performed on HEK293t cells expressing either WT hTRPA1 (black) or hTRPA1‐S873V/T874L mutant (grey). Ratio of fura‐2 fluorescence excited at 340 nm and 380 nm plotted on vertical axis. Cells were exposed to carvacrol (12.5 μm) and AITC (50 μm) for 30 s each, followed by a 20 s application of ionomycin (5 μm) to induce a maximum response for comparison. Traces are averages of 30 (WT) and 167 (mutant) cells, SEM is represented by vertical lines. F, carvacrol does not cause sensitisation of responses to AITC in the S873V/T874L mutant. Responses of hTRPA1‐S873V/T874L mutant (white bar; n = 3) to 50 μm AITC following 12 applications of 100 μm carvacrol were of similar magnitude to naive responses to 50 μm AITC in WT channels (black bar; n = 9; P = 0,99). In contrast, WT channels that had been sensitised by repeated application of AITC (grey bar; n = 8) displayed significantly larger responses (P = 0,015 compared to white, P < 0,001 compared to black; one‐way ANOVA with Bonferroni post hoc analysis). Values for the unsensitised and sensitised WT channels are the same as in Fig. 1 D and F, 1st and 8th response, respectively. #Compared to S873V/T874L. *Compared to WT unsensitised.
