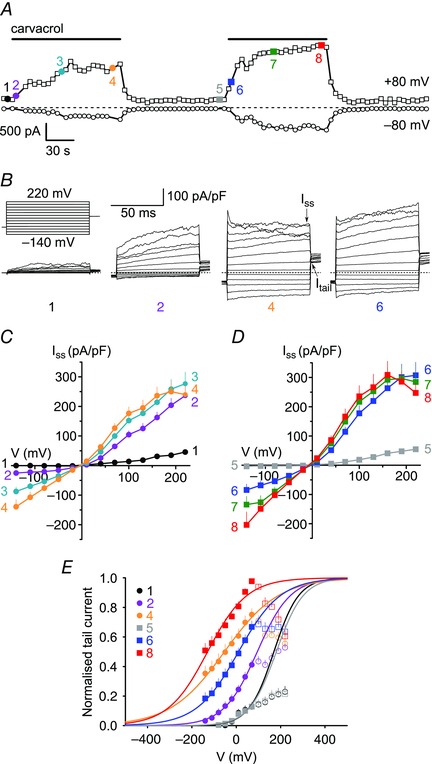
Figure 6. Effect of repeated carvacrol application on the voltage dependence of TRPA1 .

A, representative time course of whole‐cell currents elicited by two consecutive 120 s applications of 100 μm carvacrol, measured in hTRPA1‐expressing HEK293t cells at −80 mV (bottom trace) and +80 mV (top trace). Dashed line represents zero current level. At the coloured time points labelled 1–8, voltage dependence was tested using the step‐pulse protocol illustrated in B. B, currents recorded at the designated time points in A using the indicated step‐pulse protocol of 80 ms voltage steps from a holding potential of −60 mV ranging from −140 mV to +220 mV in 30 mV increments, followed by a final step to +60 mV. Time points for the measurement of steady‐state (I ss) and tail (I t) currents are indicated by arrows. C, I–V relationships obtained at the end (I ss) of the voltage steps illustrated in B. Shown are average I–V curves for time points 1–4 during the first carvacrol application. D, I–V relationships for time points 5–8 during the second carvacrol application. E, normalised tail currents measured at +60 mV at the indicated time points. Curve fitting was restricted to the voltage domain below +100 mV in order to avoid channel inactivation at strongly depolarised membrane potentials (see main text). Data points that were not included in the fit are shown as open symbols. Continuous lines are best fits to Boltzmann functions (n = 11 cells). The following V ½ values and slope factors (in brackets) were obtained for the given time points: time point 1, +170 mV (54 mV); time point 2, +94 mV (75 mV); time point 4, −36 mV (114 mV); time point 5, +179 mV (57 mV), time point 6, +22 mV (95 mV); time point 8, −132 mV (84 mV). [Colour figure can be viewed at wileyonlinelibrary.com]
