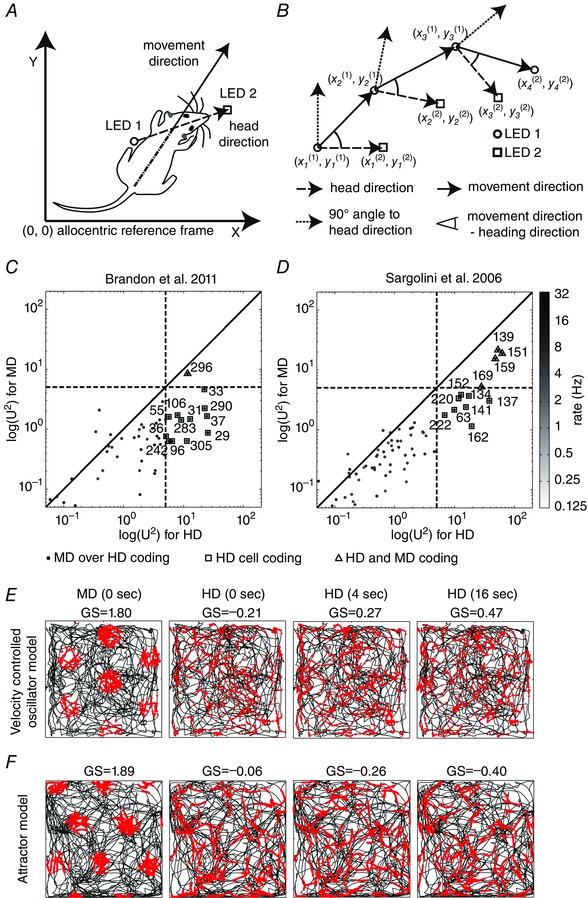
Figure 1. Analysis of single cell recording data from entorhinal cortex for head direction (HD) and movement direction (MD) along with a model simulation of grid cells using HD or MD as input .

A, we infer the head direction through the orientation given by the two LEDs, 1 and 2, and the movement direction taking the temporal advancement of the mid‐point between LED 1 and 2. B, a sketched sequence for the temporal succession of the positional sample points of LED 1 and 2 to illustrate the definition of HD, MD and the angular difference between HD and MD. C, the Watson U² for the population of 305 cells from the Hasselmo laboratory. D, the Watson U² for the population of 453 cells from the Moser laboratory. Plotted points of the Watson U 2 for MD tuning versus Watson U² for HD tuning are from the same cell. Axes are log‐scaled as are the grey values that represent the firing rate of each cell in hertz. Cells whose Watson U² pair is below the diagonal primarily encode HD, whereas those above the diagonal primarily encode MD. The distribution of cells is predominantly biased toward statistical encoding of HD rather than MD. Numbers denote cell indices. Dashed lines mark the threshold of 5 for the U²s that we used to categorize HD and MD cells. Plotted squares around points indicate HD coding and plotted triangles around points indicate combined HD and MD coding. E, simulations of the velocity controlled oscillator (VCO) model (top row) and attractor model (bottom row) with MD or HD as directional input. The speed input was that of the measured trajectory. Different panels show the simulated cell firing for the HD or MD while integrating over a 0, 4 or 16 s time window. Whenever HD is provided as input no grid cell firing appears (last three columns in E and F). In contrast, the direct input of MD (0 s time window) produces grid cell firing (first column in E and F). Adapted from Raudies et al. (2015).
