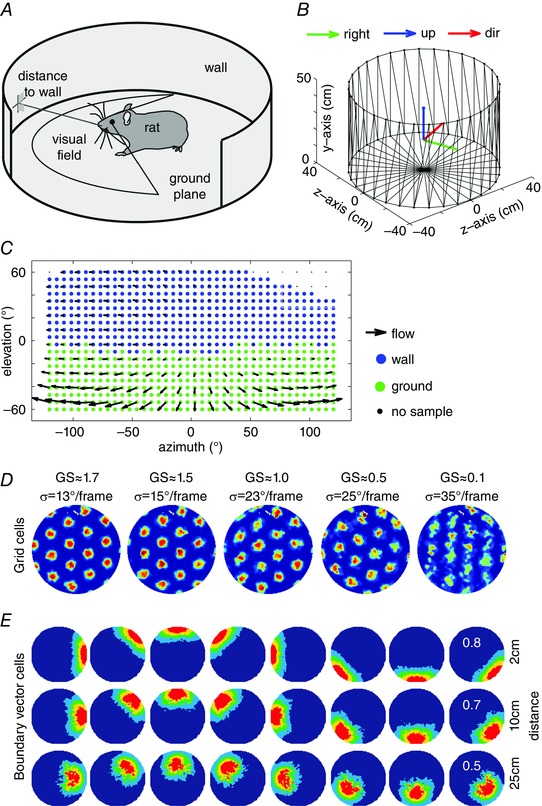
Figure 2. Modelled firing patterns of simulated grid cells and boundary vector cells using optic flow as input .

A, a rat in a circular box with a depiction of its distance to the wall. B, simulated box environment for boundary vector cells. The coordinate system (red, blue and green arrows) indicates the initial position and orientation of the simulated visual field of the rat. C, an optic flow field for a spherical camera with its segmentation into ground plane (green dots) and wall (blue dots). This optic flow field is used to estimate the linear and rotational velocity of the rat as well as the distance of the wall in ego‐centric space and the orientation of the wall in allo‐centric space. Adapted from Raudies & Hasselmo (2012). D, simulated grid cell firing using the oscillatory interference model while superimposing independent, additive Gaussian noise onto the optic flow components with a standard deviation σ of 13, 15, 23, 25 and 35 deg frame−1. The simulated grid cell firing vanishes above a standard deviation of σ ≈ 23 deg frame−1. The simulation uses the trajectory ‘Hafting_Fig2C_Trial1’ from Hafting et al. (2005). The box has a diameter of 100 cm with a 15 cm annulus added to provide visual features beyond the limits of locomotion. Adapted from (Raudies et al. 2012). E, the rate map of our model for boundary vector cells when estimating distance and direction of walls from optic flow. The box has a diameter of 79 cm and the height of the wall is 50 cm.
