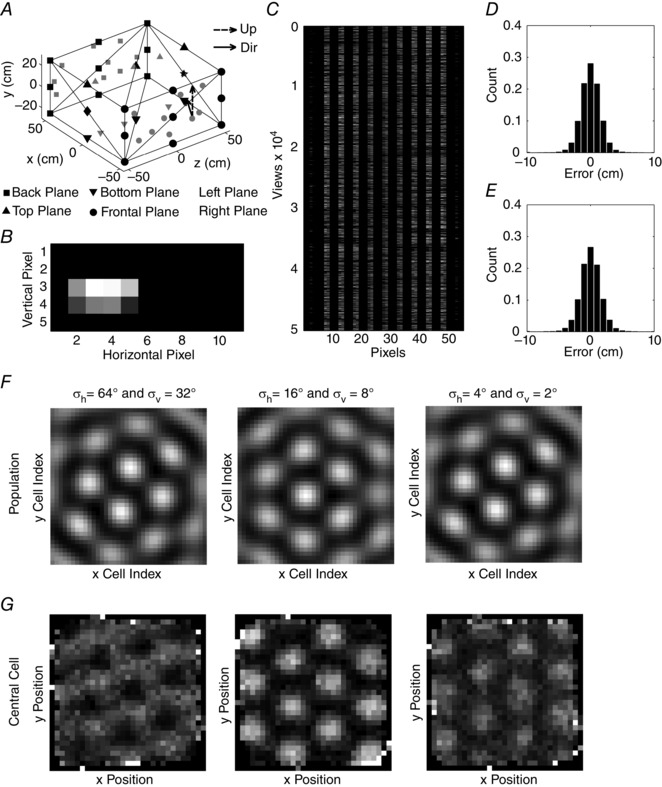
Figure 4. The simulation of grid cells using a wave model that is driven by the position signal that in turn is retrieved from visual views .

A, enclosure used in the simulation with ground (downward triangle), side walls (square, circle, diamond and star symbols), and ceiling (upward triangle) – in the actual simulation the lines were not present. Black symbols show the positions of features before random displacement on their associated surface (i.e. ground, walls or ceiling). Scattered features are drawn as grey symbols. All features were identical for the actual generation of an image. B, exemplar image for the camera position indicated in A by the direction (Dir) vector and upward vector (Up). Bright regions indicate the overlay of 2D Gaussian blobs generated by features. C, stored images for 50,000 sample points and 11 pixel × 5 pixel or 55 total pixel values. Grey values for pixels in the image are flattened along the vertical dimension. D, position errors for retrieval in the horizontal direction are fitted by a normal distribution with zero mean and a standard deviation of 2.79 cm. E, position errors in the vertical direction are fitted by a normal distribution with zero mean and a standard deviation of 3.10 cm. F, population responses and firing pattern of the central cell for images generated by 2D Gaussians with σh = 64° and σv = 32° (fist column), σh = 16° and σv = 8° (second column), and σh = 4° and σv = 2° (third column). The population response at a single time step in F shows that the wave model always generates a hexagonal grid pattern at individual time steps. Bright encodes a high activation and dark a low activation of cells. G, firing patterns of the central cell in the population were recorded over 50,000 sample steps. This shows how accurately the population activity is shifted over time by the estimate of position based on visual input, in order to allow a single cell to fire like a grid cell during the full trajectory. Bright indicates a high firing rate and dark indicates a low firing rate. The GSs are −0.37, 1.91 and 0.93 for the first, second and third column, respectively, indicating best performance with the intermediate Gaussian widths that allow best generalization of visual images over nearby positions.
