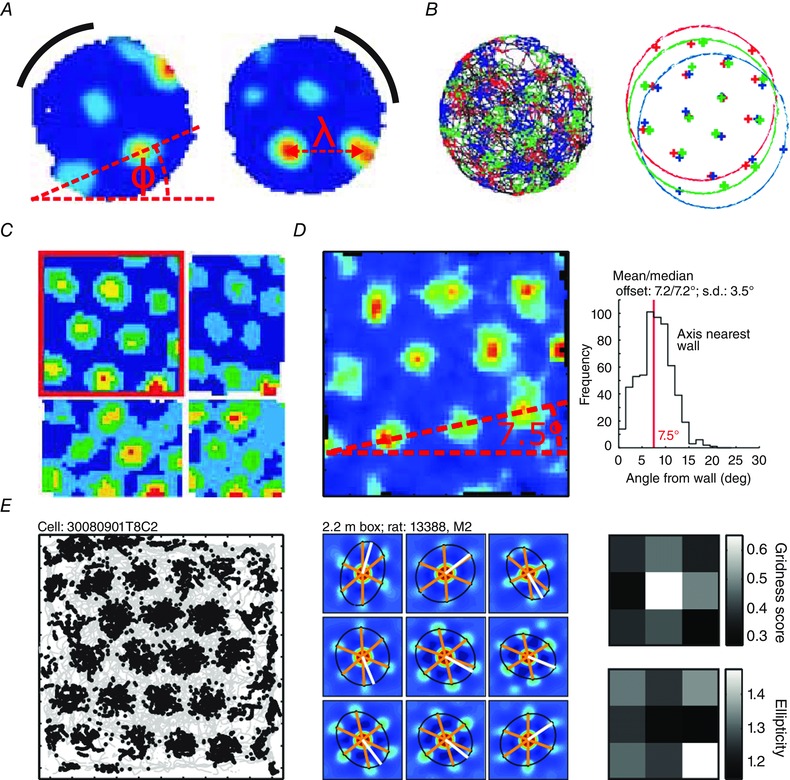
Figure 2. The grid cell path integration system .

A, rotation of a black cue card causes rotation of the grid pattern. Φ shows the grid orientation, λ the grid scale (adapted with permission from Hafting et al. 2005). B, topologically neighbouring grid cells (red, green, blue) have different spatial phases, but equal scale and orientation (adapted with permission from Hafting et al. 2005). C, animals were placed in an environment with moveable walls (adapted with permission from Barry et al. 2007). Grid cell firing patterns responded to uniaxial (top right, bottom left) and biaxial (bottom right) contraction and returned to their original configuration (top left). D, grids have three measures of orientation corresponding to their three axes. In a square environment, the angle from the wall is defined as the smallest of the three axis angles from their nearest wall. The smallest of these three angle clusters bi‐modally about 7.5 deg (adapted with permission from Stensola et al. 2015). E, left, an example binned spike map in a 2.2 m2 box. Middle, ellipses fitted to the innermost six peaks of the local autocorrelogram (different to right). Right, ellipticity and gridness scores in different sections of a 2.2 m2 box, showing greater distortion near the edges (adapted with permission from Stensola et al. 2015).
