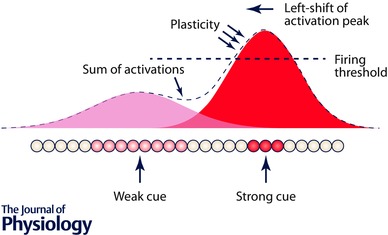
Figure 4. Shift of activation in a ring attractor network from a strong cue towards a weaker one .

The attractor is shown linearised for convenience; the Gaussian curves depict the external drive (from sensory cues; idiothetic for the weak cue and landmark‐based for the strong one) onto the network. Because of the overlap of this drive, an asymmetry of activation occurs, with greater activation in the zone between the two cues. For the stronger cue, which is able to drive neurons to their activation threshold, this asymmetry results in asymmetric synaptic strengthening (dashed line), which will result in a shift of the activation peak in the direction of overlap, with the final result as shown in Fig. 1.
