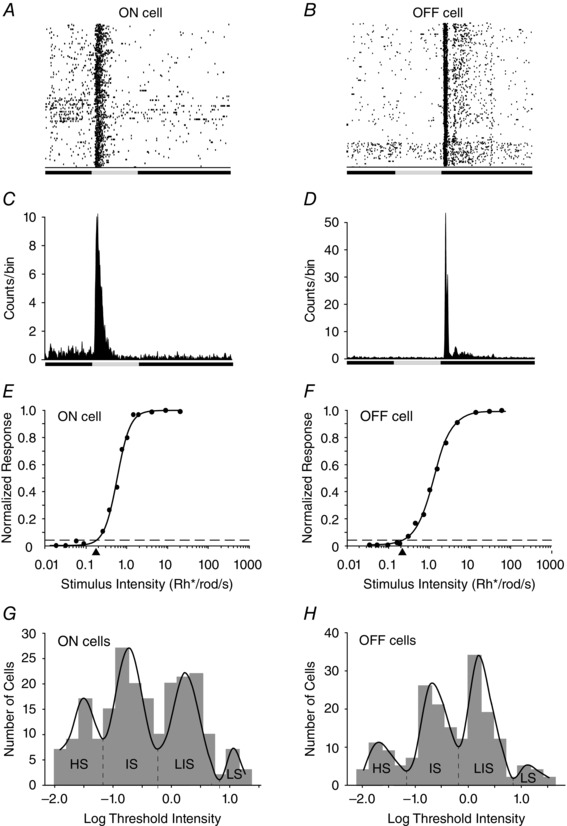
Figure 2. Dark‐adapted mouse retinal gangion cells (RGCs) are divisible by their different threshold sensitivities .

A, raster plot of multiple responses of an ON RGC to a 0.5 s full‐field light stimulus. B, raster plot of multiple responses of an OFF cell to 0.5 s light stimulus. C, peristimulus time histogram of an ON RGC to 10 presentations of a 0.5 s full‐field light stimulus. D, peristimulus time histogram of an OFF cell to a 0.5 s full‐field light stimulus. E, intensity–response plot of an ON RGC with data points fitted by a Michaelis–Menten equation. The threshold sensitivity of the cell was calculated as 5% of the maximal response (spike frequency) and is indicated by the arrowhead below the x‐axis and falls within the intermediate sensitivity range. F, intensity–response function of an OFF RGC with a threshold sensitivity (arrowhead) falling in the intermediate sensitivity range. G, histogram showing the range of threshold intensities calculated from the intensity–response functions of the population of dark‐adapted ON RGCs in the study. Although the thresholds were found to be continuous, they could be differentiated into four groups [high (HS), intermediate (IS), low‐intermediate (LIS) and low (LS) sensitivity], based on a non‐linear regression fit. H, histogram showing the range of threshold intensities calculated from the intensity–response functions of the population of dark‐adapted OFF RGCs in the study. Similar to that shown for the ON cells, the OFF cells could be differentiated into four groups [high (HS), intermediate (IS), low‐intermediate (LIS) and low (LS) sensitivity], based on a non‐linear regression fit of the threshold range.
