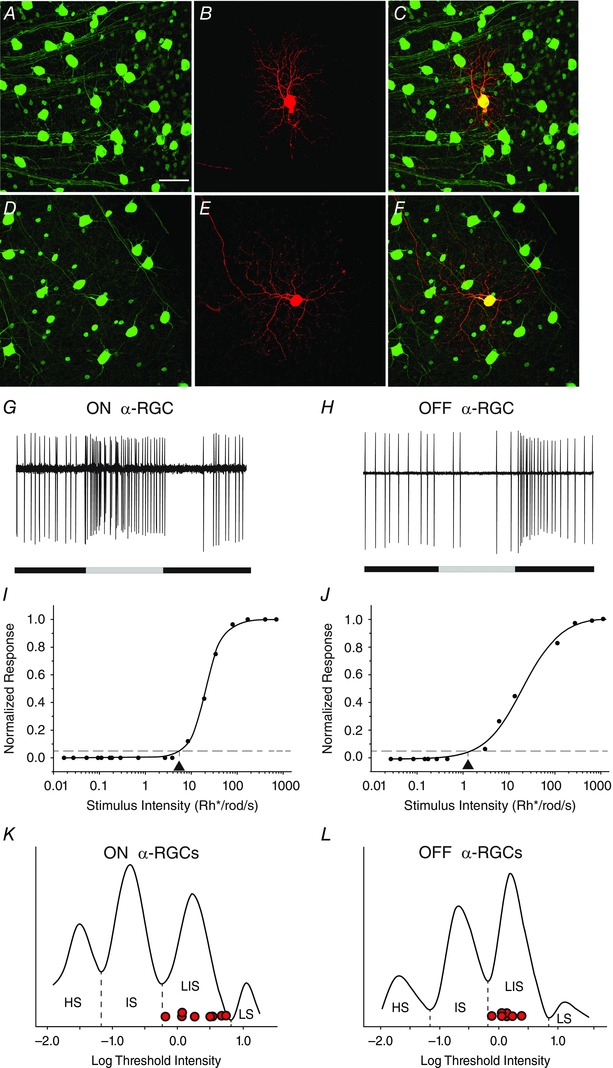
Figure 3. Dark‐adapted ON and OFF α‐RGCs show threshold sensitivities consistently in the LIS range .

A and D, the α‐RGCs in the Kcng4‐YFP mouse retina express YFP and can be visualized and targeted for recording. Scale bar for panels A–F represents 50 μm. B, an ON α‐RGC was targeted and injected with neurobiotin to reveal its soma–dendritic morphology. C, merge of A and B. E, an OFF α‐RGC was targeted and injected with neurobiotin. F, merge of D and E. G, spike response of the ON sustained α‐RGC shown in A–C to a 500 ms full‐field light stimulation (intensity = 13.9 Rh* per rod s−1). H, spike response of the OFF sustained α‐RGC shown in D–F to a 500 ms full‐field light stimulation (intensity = 13.9 Rh* per rod s−1). I, intensity–response function of the ON sustained α‐RGC, showing a threshold sensitivity of 0.65 Rh* per rod s−1). J, intensity–response function of the OFF sustained α‐RGC, showing a threshold sensitivity of 1.5 Rh* per rod s−1. K and L, distribution of threshold sensitivities of ON and OFF RGCs from Fig. 2 G and H, respectively, with the threshold sensitivities of eight ON and eight OFF α‐RGCs (red circles) show that they all fall within the range of LIS cells. [Colour figure can be viewed at wileyonlinelibrary.com]
